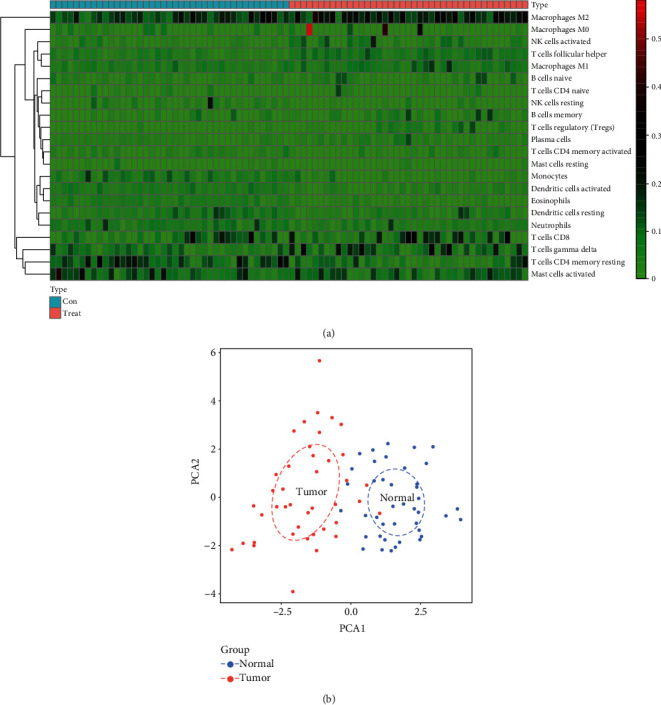
Figure 3.

The differences in immune cell infiltration between MESO and normal tissues. (a) Heatmap showing the difference in infiltration levels of 22 kinds of immune cells between MESO and normal samples. (b) Principal component analysis depicting the distinction between MESO and normal tissues based on these immune cells. The blue dots indicate normal samples, and the red dots indicate tumor samples.
