
Figure 4.
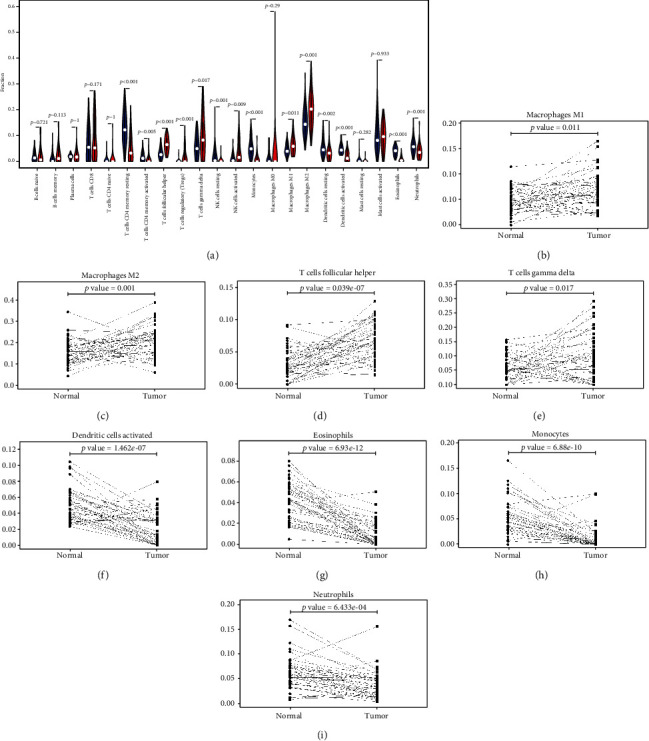
The differences in immune cell infiltration between MESO and paired normal tissues. (a) Violin plots visualizing the distributions of TIICs between MESO and paired normal tissues. Blue represents normal samples and red indicates MESO samples. The infiltration levels of (b) M1 macrophages, (c) M2 macrophages, (d) T cell follicular helper, (e) T cell gamma delta, (f) activated dendritic cells, (g) eosinophils, (h) monocytes, and (i) neutrophils were different between the two groups.