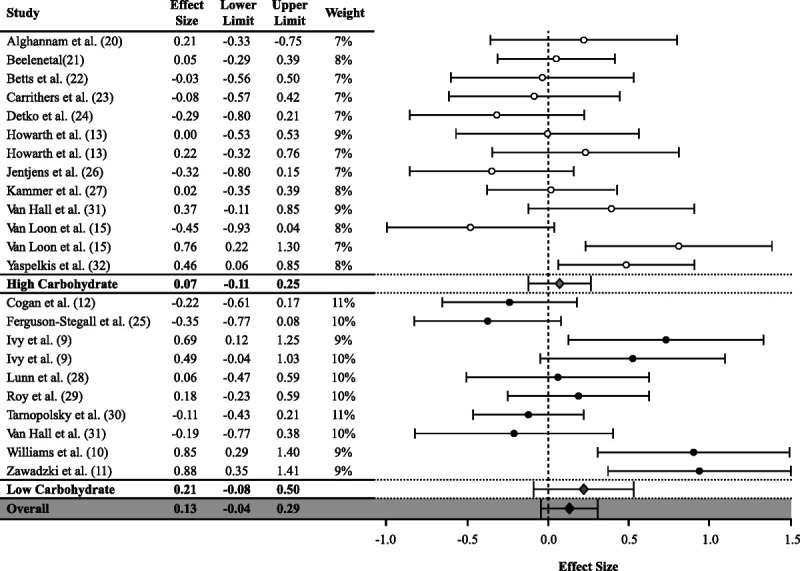
FIGURE 3.

Values are presented as ES (95% CI) stratified by median relative carbohydrate content (high carbohydrate, ≥0.8 g·kg−1⋅h−1; low carbohydrate, <0.8 g·kg−1⋅h−1).

Values are presented as ES (95% CI) stratified by median relative carbohydrate content (high carbohydrate, ≥0.8 g·kg−1⋅h−1; low carbohydrate, <0.8 g·kg−1⋅h−1).