
Figure 2.
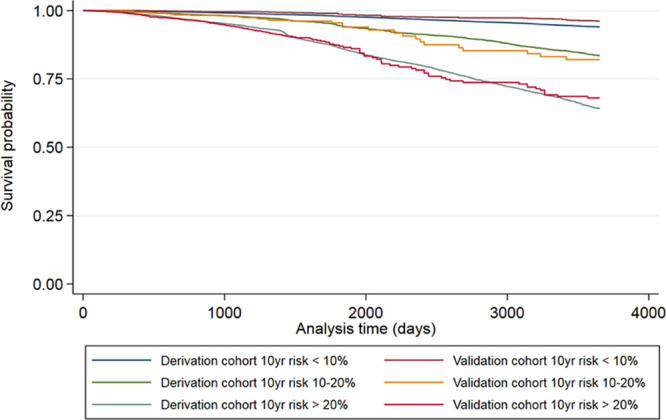
Kaplan-Meier plots comparing all-cause mortality for the derivation and validation cohorts for 3 risk groups corresponding to 10% and 20% 10-year risk thresholds.
Official websites use .gov
A
.gov website belongs to an official
government organization in the United States.
Secure .gov websites use HTTPS
A lock (
) or https:// means you've safely
connected to the .gov website. Share sensitive
information only on official, secure websites.
Kaplan-Meier plots comparing all-cause mortality for the derivation and validation cohorts for 3 risk groups corresponding to 10% and 20% 10-year risk thresholds.