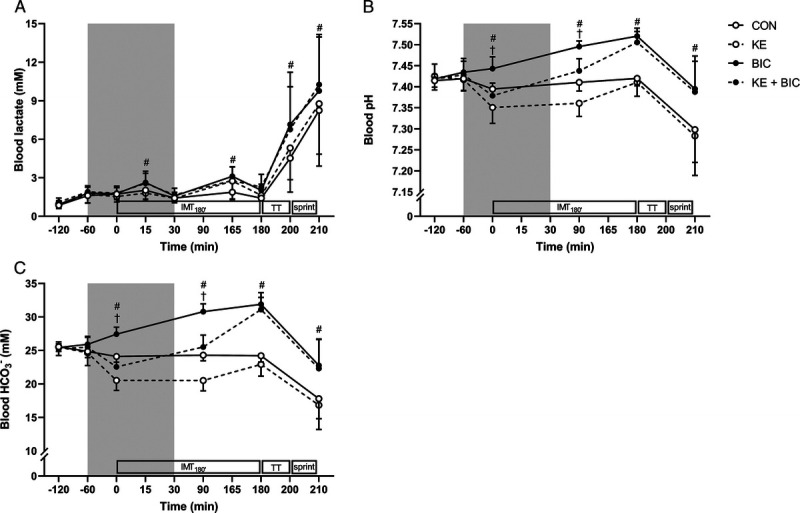
FIGURE 3.

Effect of KE and/or bicarbonate supplementation on blood lactate, pH, and bicarbonate concentration. Data are presented as mean ± SD for blood lactate (A), pH (B), and bicarbonate (HCO3−) concentration (C). In a crossover design, participants (n = 9) received control (, CON), KE (, KE), bicarbonate (, BIC), or KE and bicarbonate (, KE + BIC) before and during exercise (gray zone). #P < 0.05 for effect of BIC (BIC and KE + BIC vs CON and KE). †P < 0.05 for effect of KE (KE and KE + BIC vs CON and BIC). IMT180′, 3 h submaximal intermittent cycling; TT, 15-min time trial; sprint, ~1‐min all-out exercise bout at 175% LT.
