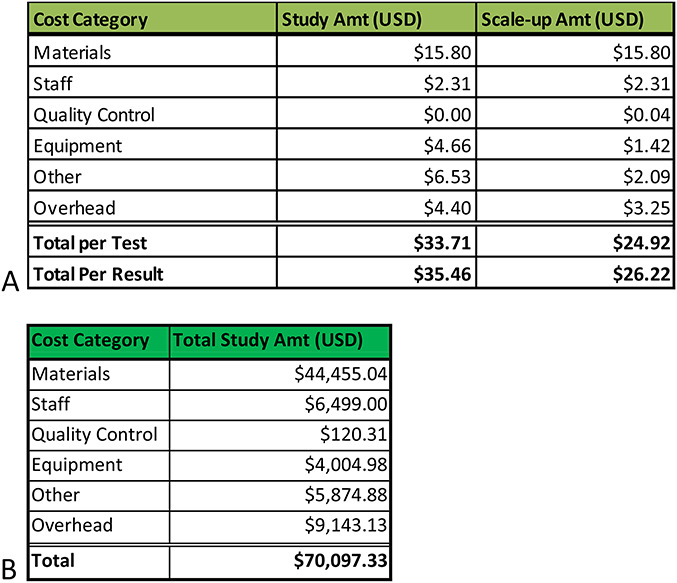
FIGURE 1.

A, Cost per test and per result broken down by the main categories of cost components for the study and in a scale-up scenario. B, Cost per category for running the program for the year of 2017, including startup costs and the 2813 POC tests run during this intervention.
