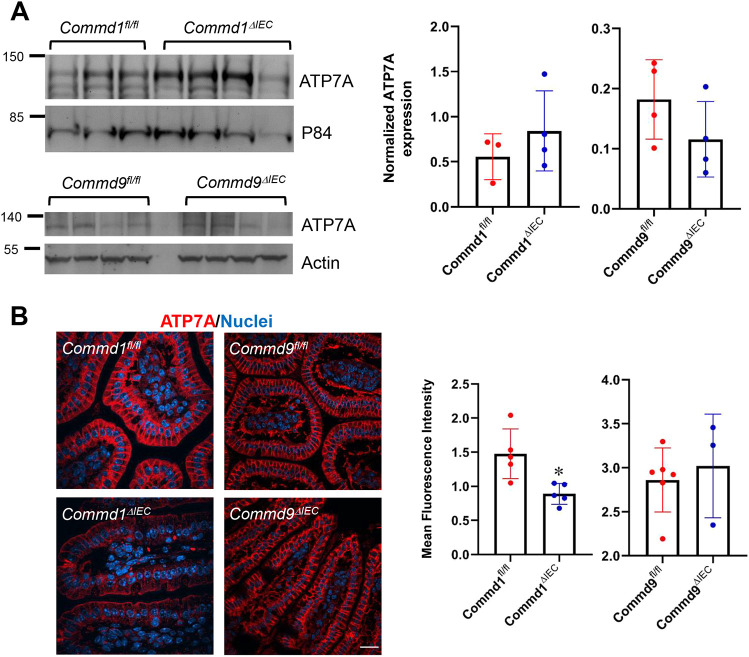
Fig. 2.
ATP7A expression is diminished in Commd1 but not Commd9 intestinal knockout mice. (A) Immunoblot analysis for ATP7A expression in Commd1 and Commd9 intestinal knockout mice (top). ATP7A quantification after normalization by the loading control (P84 or actin) (bottom). (B) Representative images of immunofluorescence staining for ATP7A (red) and nuclei (Hoechst, blue) in intestinal tissues of Commd1ΔIEC (n=5) or Commd9ΔIEC (n=3) mice (bottom row) or corresponding control floxed animals, Commd1fl/fl (n=4) and Commd9fl/fl (n=6) (top row). Scale bar: 25 µm. Bar graphs represent quantification of ATP7A signal intensity in immunofluorescence staining of intestinal tissues, expressed as the fold change over the nuclear staining. Results for individual mice are plotted along with the mean and s.e.m. for each group; *P<0.05 (unpaired two-tailed Student's t-test).

