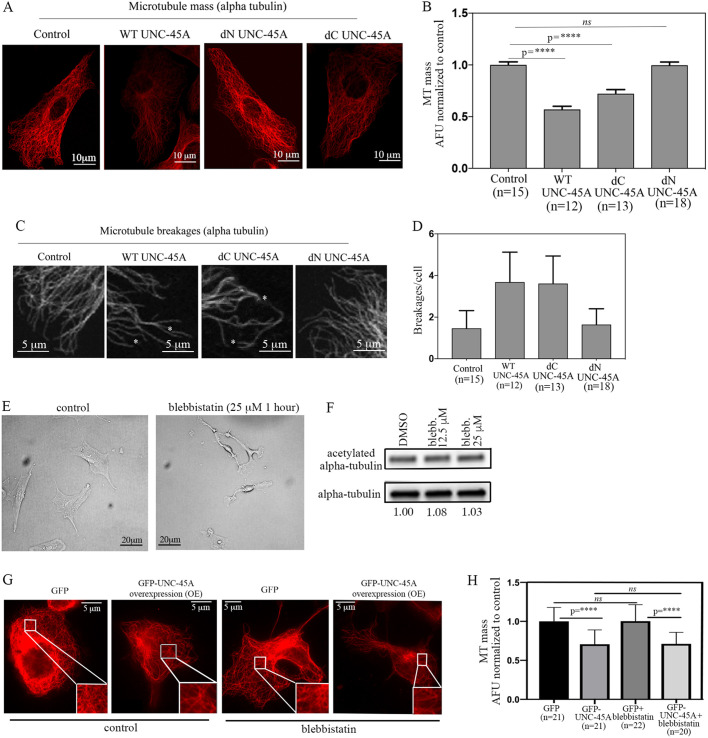
Fig. 6.
UNC-45A breaks MT in the absence of its C-terminal NMII-binding domain and in the presence of the NMII inhibitor blebbistatin. (A) Representative images of RFL-6 cells transduced with either empty vector (FLAG), WT UNC-45A, C-terminally deleted UNC-45A (dC UNC-45A), or N-terminally deleted UNC-45A (dN UNC-45A) FLAG-tagged proteins and stained for alpha-tubulin (red). All images were taken using the same exposure time. (B) Quantification of MT mass per condition expressed as AFU. n=number of cells analyzed per condition (three different areas per cell were evaluated). (C) Representative images of RFL-6 cells transduced with either empty vector (FLAG), WT UNC-45A (WT), C-terminally deleted UNC-45A (dC UNC-45A) or N-terminally deleted UNC-45A (dN UNC-45A) FLAG-tagged proteins stained for alpha-tubulin (red) to visualize MTs and their breakages. All images were taken using the same exposure time. Black and white images are shown for better visualization. Asterisks indicate MT breakages. (D) Quantification of MT breakages per cell per condition. n=number of cells analyzed per condition. Differences between values for conditions were non-significant. (E) Representative image of RFL-6 cells either mock treated or treated with the indicated concentration of blebbistatin over 1 h. (F) Levels of acetylated tubulin versus total tubulin (numbers indicate the ratio) in control (DMSO) versus blebbistatin-treated RFL-6 cells. (G) Representative images of MT mass in control (GFP) and GFP-UNC-45A OE RFL-6 cells (24 h post-infection) with or without blebbistatin treatment (25 µM for 1 h) after staining with an anti-alpha-tubulin antibody to visualize MTs. All images were taken using the same exposure time. (H) Quantification of MT mass per condition. n=number of cells evaluated per condition (three different areas per cell were evaluated). ****P<0.0001; ns, not significant.

