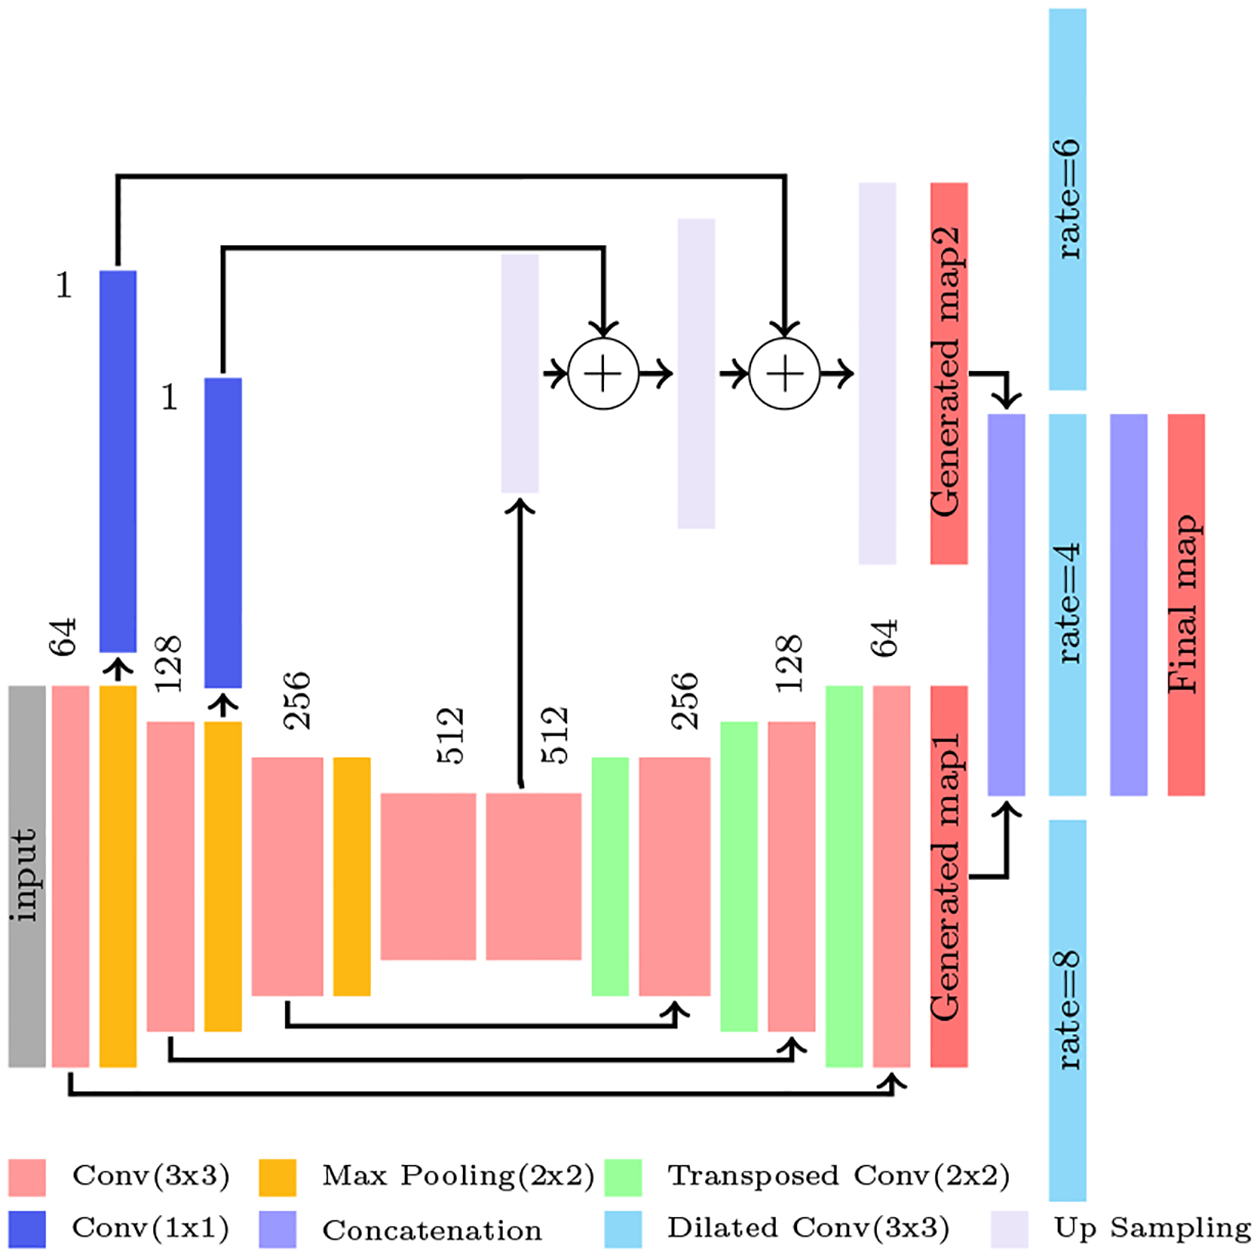
Figure 2:

The illustration of the full network architecture. The prediction from Pooling layers 1 and 2 and also the prediction from the Convolution layer 5 from the core model is extracted and fed to up sampling layers shown in purple to achieve the second map. Then, map1 and map 2 is concatenated and fed to three dilated convolution layer shown in cyan. Finally the outputs of these three layers are concatenated and generates the final map. The circles with + symbol means the feature maps summation.
