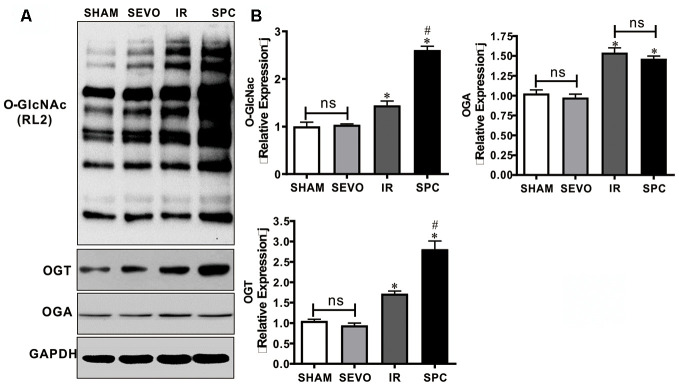
Figure 3.
SPC up-regulated the expression of O-GlcNAc and OGT proteins. (A) Representative protein images of O-GlcNAc, OGT and OGA from all groups were shown. (B) Quantitative analysis of O-GlcNAc, OGT and OGA proteins were performed. n = 3 /group. The columns and errors bars represent means ± SD. * P < 0.05 vs. SHAM group; # P < 0.05 vs. IR group.

