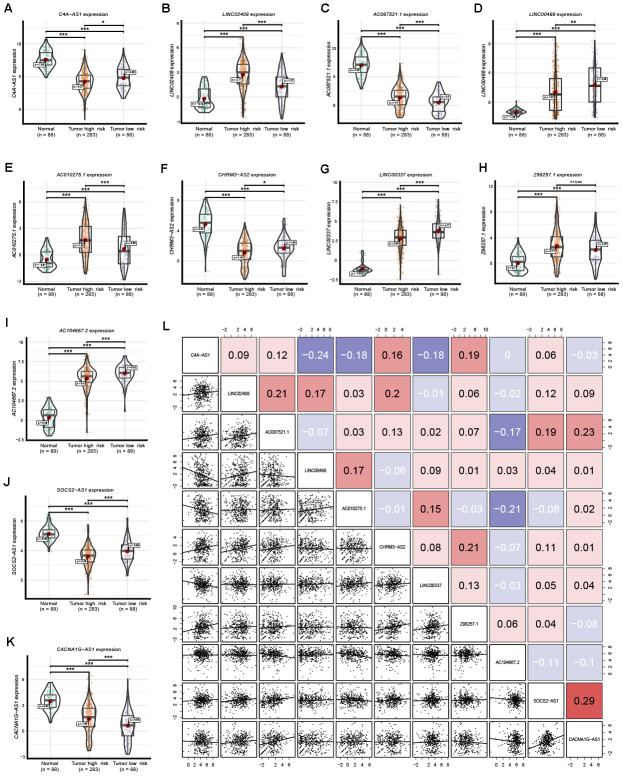
Figure 7.
Expression of the 11 prognostic signature lncRNAs among normal ovarian tissues, SOC tumor high-risk and SOC tumor low-risk groups. (A–K) The expression level of the 11 prognostic signature RNAs among normal tissue, high-risk and low-risk groups. (L) Correlation among these 11 prognostic signature RNAs. Numbers indicate the Pearson coefficients.

