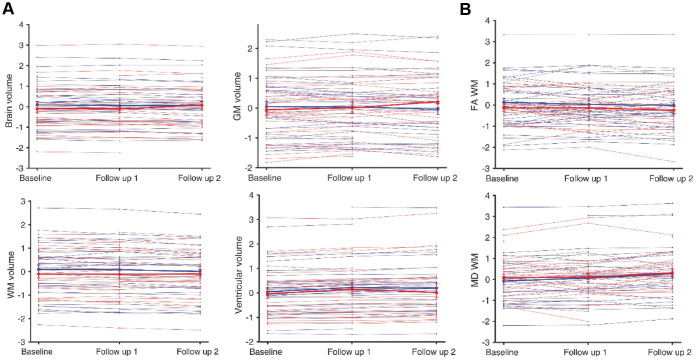
Figure 3.
Total Brain, GM, WM and ventricular volume (A), and FA and MD associated with WM of trial participants (B). Thin lines represent individual participants whereas thick lines illustrate the average of the choral singing (blue, 37 participants) and health education (red, 34 participants) groups. Values are normalized to sample average baseline. Error bars represent the standard error of the mean.

