Figure 9.
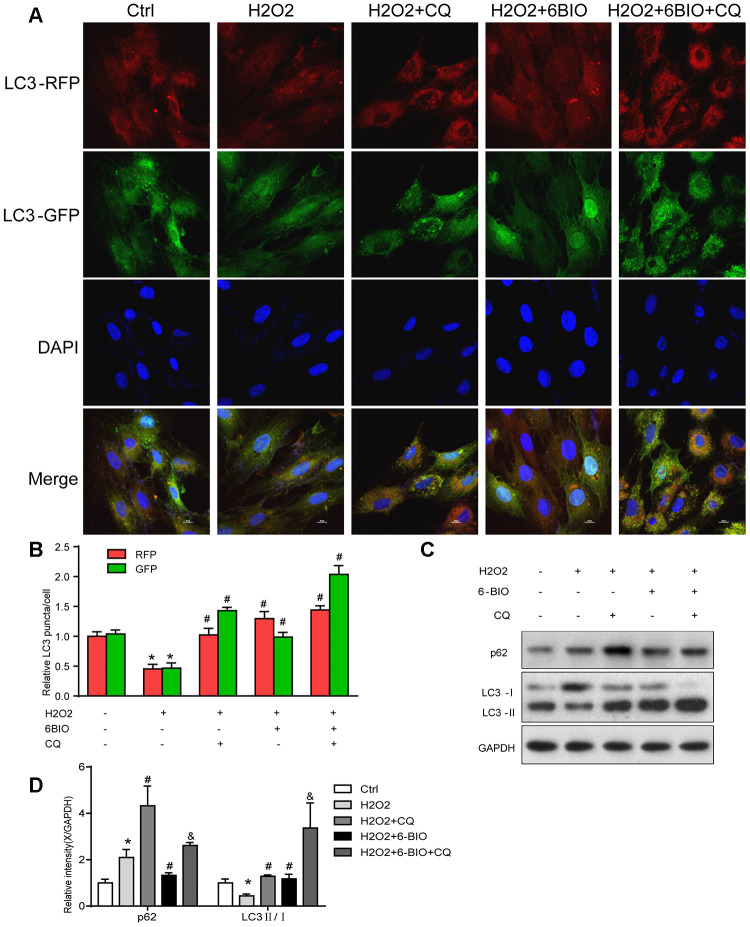
The autophagy flux analysis. (A) Represent images were captured under fluorescence microscope with 1000× magnification. Autophagosomes were labelled by both green and red punctate dots and autolysosomes were labelled by red puncta only. (B) Quantification of relative LC3 puncta was plotted. (C, D) The autophagy-related proteins were assessed using Western blot. *P<0.05 compared with the control group treated with PBS; #P<0.05 compared with the H2O2-induced aging group; &P<0.05 compared with the H2O2+CQ group.

