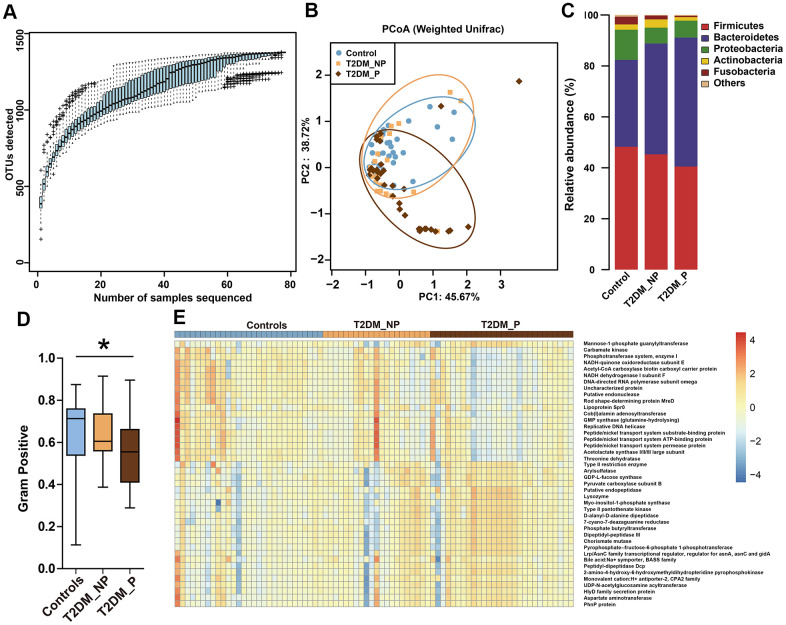
Figure 1.
Differences in gut microbiota profile among three groups. (A) OTU accumulation boxplot to show that the number of samples is adequate. (B) Principal Co-ordinates Analysis (PCoA) plot of weighted UniFrac distances. (C) Fecal microbiota composition at the phylum level among the three groups. (D) BugBase algorithm predicted that microbiota phenotypes of the T2DM_P group significantly differed from healthy volunteers in terms of gram-positive bacteria. (E) Heatmap of PICRUSt analysis shows significant KEGG pathways among the three groups.

