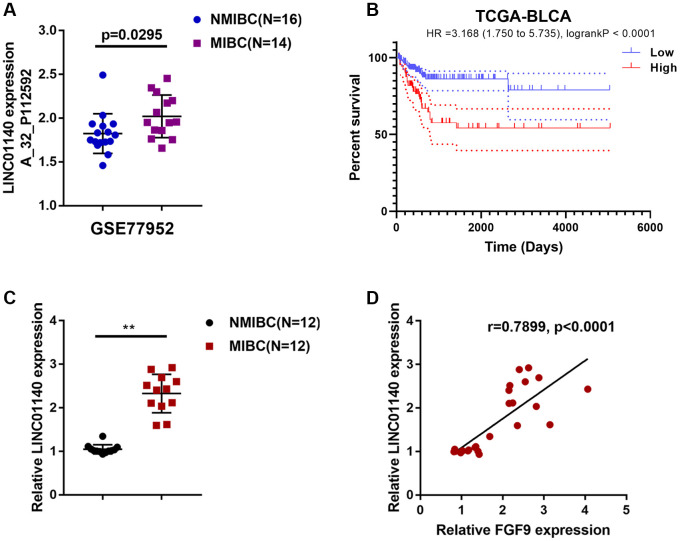
Figure 3.
Expression of lncRNA LINC01140 in NMIBC and MIBC tissues. (A) The expression of lncRNA LINC01140 in MIBC and NMIBC tissues based on the data from GSE77952. P=0.0295, student’s T test. (B) The overall survival of patients with bladder cancer was analyzed by grouping the samples based on LINC01140 expression using log-rank test. Data are based on TCGA database. (C) The expression of LINC01140 in tissues of 12 cases of MIBC and 12 cases of NMIBC was determined using real-time PCR. P<0.01, paired student’s T test. (D) The correlation between LINC01140 and FGF9 expression in tissue samples was analyzed using Pearson’s correlation analysis. **P<0.01.

