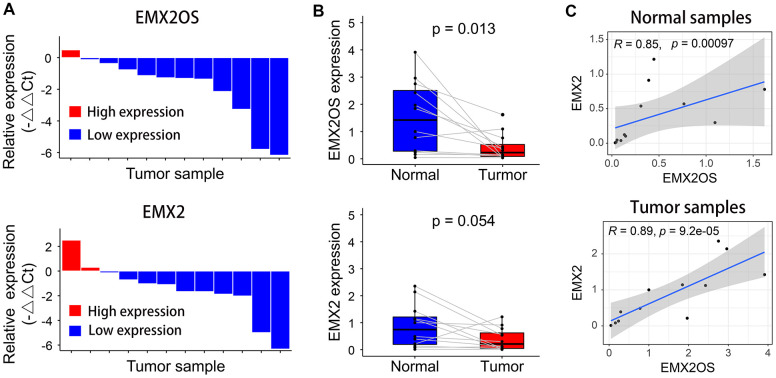
Figure 4.
Relative expression levels of EMX2OS and EMX2 in 12 pairs of KIRC and normal samples measured using RT-qPCR. (A) EMX2OS and EMX2 were downregulated in 11 of 12 and 10 of 12 KIRC samples, respectively. (B) Compared with than in normal samples, EMX2OS was significantly downregulated in tumor samples, while no significant difference was found for EMX2. (C) There was a significant positive correlation between EMX2OS and EMX2 in both normal and tumor samples.

