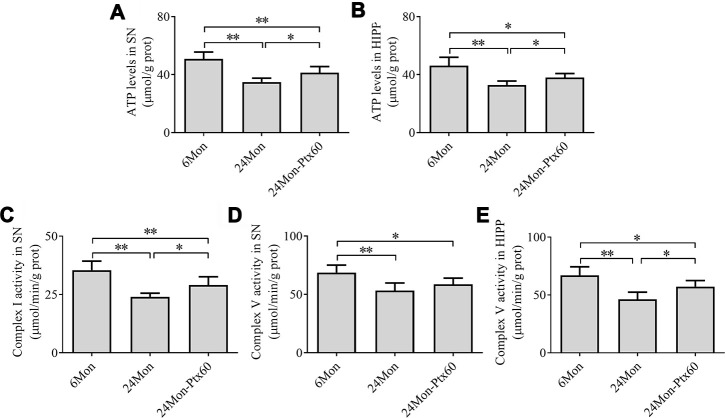
Figure 5.
Effects of PTX treatment on brain mitochondrial ATP levels and complex activity in aged rats. (A) ATP levels in the SN. (B) ATP levels in the HIPP. (C) Mitochondrial complex I activity in the SN. (D, E) Mitochondrial complex V activity in the SN and HIPP. Data are expressed as the mean ± S.D. (n=6 rats/group). *P<0.05, **P<0.01.

