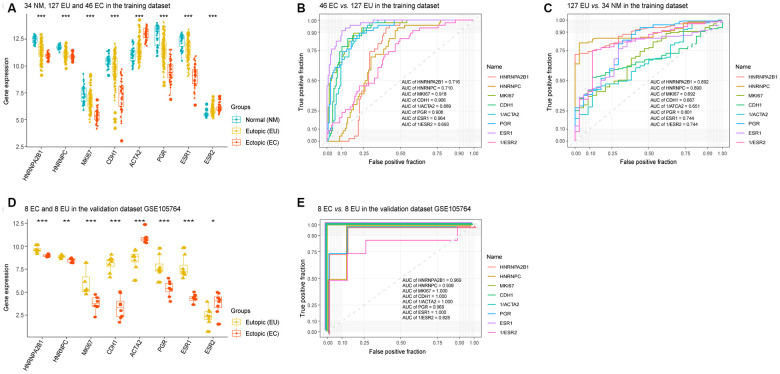
Figure 4.
The diagnostic value of HNRNPC and HNRNPA2B1 in EMs. The expression levels of HNRNPA2B1, HNRNPC, MKI67, CDH1 (E-cadherin), ACTA2 (α-SMA), PGR, ESR1, and ESR2 in the training dataset (‘Kruskal.test’) (A) and validation dataset GSE105764 (‘DEseq2’) (D). ROC analysis of HNRNPA2B1, HNRNPC, MKI67, CDH1 (E-cadherin), ACTA2 (α-SMA), PGR, ESR1, and ESR2 in the EC vs. EU matrix (B) and the EU vs. NM matrix (C) in the training dataset, and the EC vs. EU matrix in validation dataset GSE105764 (E). EMs, endometriosis; NM, normal endometrium; EU, eutopic endometrium; EC, ectopic endometrium; ROC, receiver operating characteristic; AUC, areas under the curve. * p < 0.05; ** p < 0.01; *** p < 0.001.

