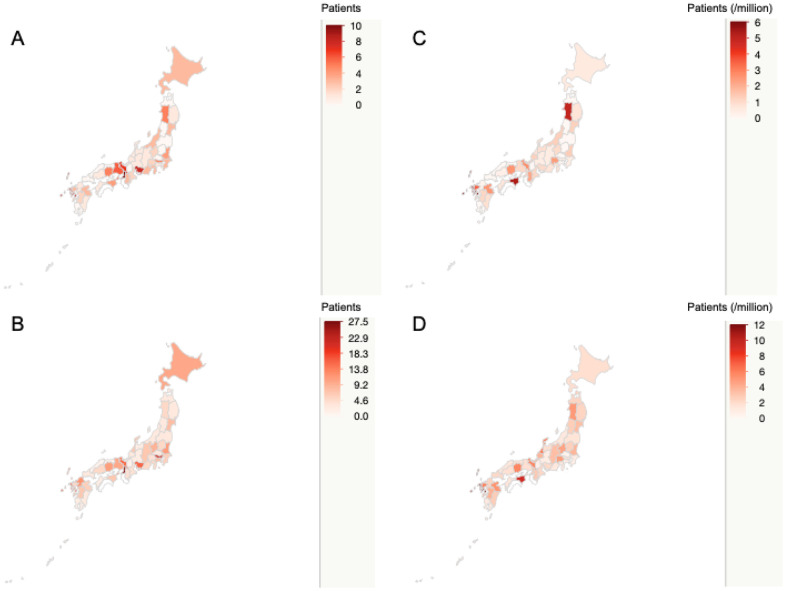
Figure 1.
Nationwide distribution of patients with Werner syndrome in Japan. The map shows the nationwide distribution of patients with Werner syndrome. The concentration of red indicates the number of patients. The upper left map (A) shows the nationwide distribution of diagnosed cases. The lower left map (B) shows the nationwide distribution of total patients including diagnosed cases, suspected cases, and past confirmed cases. The upper right map (C) shows the diagnosed cases per million population. The lower right map (D) shows total patients including diagnosed cases, suspected cases, and past confirmed cases per million population.

