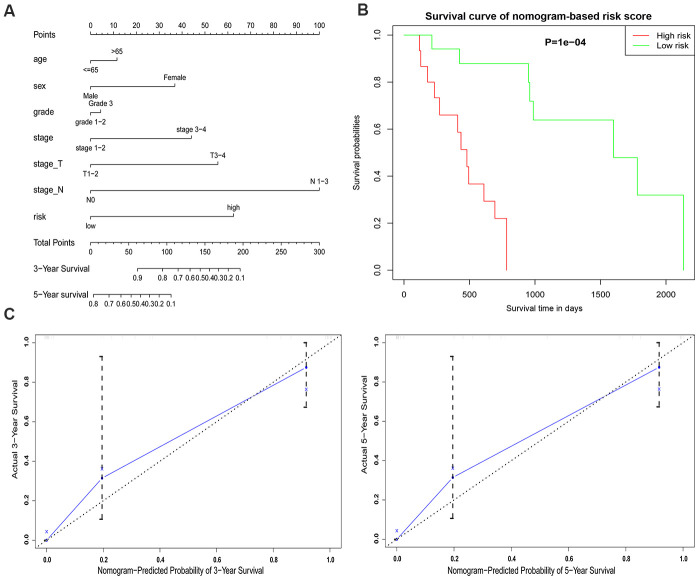
Figure 9.
An established nomogram model predicting 3- and 5-year OS of EAC patients. (A) Nomogram incorporated with the five-gene signature and clinical factors for prediction of the 3- and 5-year OS in patients with EAC in the TCGA dataset. (B) Survival curve based on the nomogram grouped by risk score. (C) Calibration curve of the nomogram for the prediction of 3- and 5-year OS.

