Figure 3.
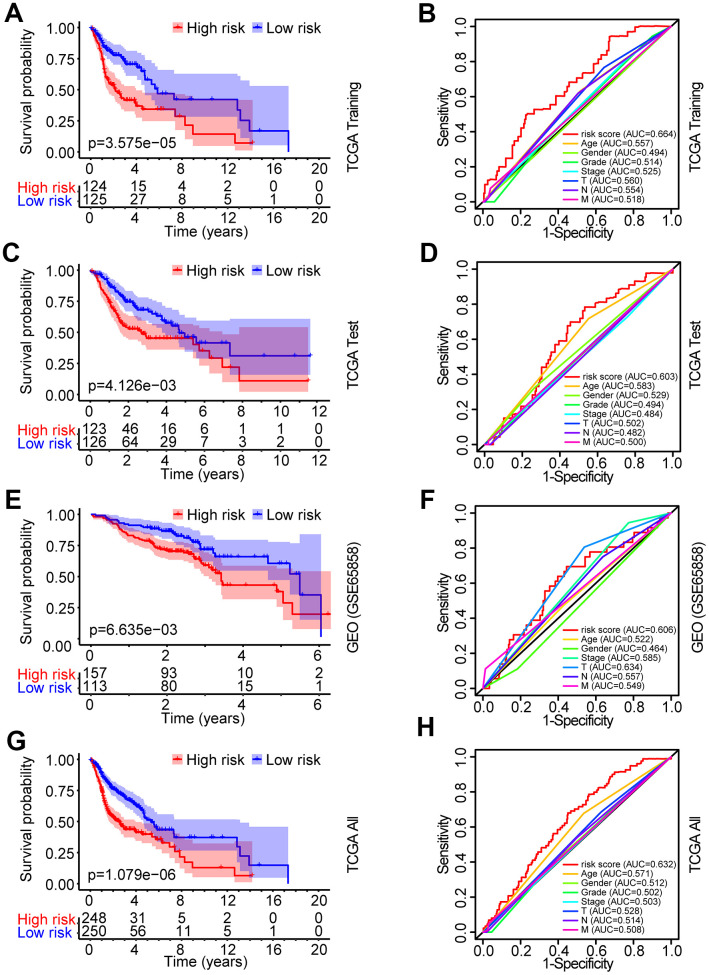
Identification and verification of the prognostic risk model in HNSCC. (A) Kaplan-Meier survival curve analysis of OS in the high-risk and low-risk groups of HNSCC patients in the TCGA training set. (B) ROC curve analysis and AUC for the risk score of AGs in the TCGA training set. (C, E, G) Kaplan-Meier survival curve analysis of OS in the high-risk and low-risk groups of HNSCC patients in the TCGA test set, GEO data set and TCGA all data set, respectively. (D, F, H) ROC curve analysis and AUC for the risk score of AGs in the TCGA test set, GEO data set and TCGA all data set, respectively.

