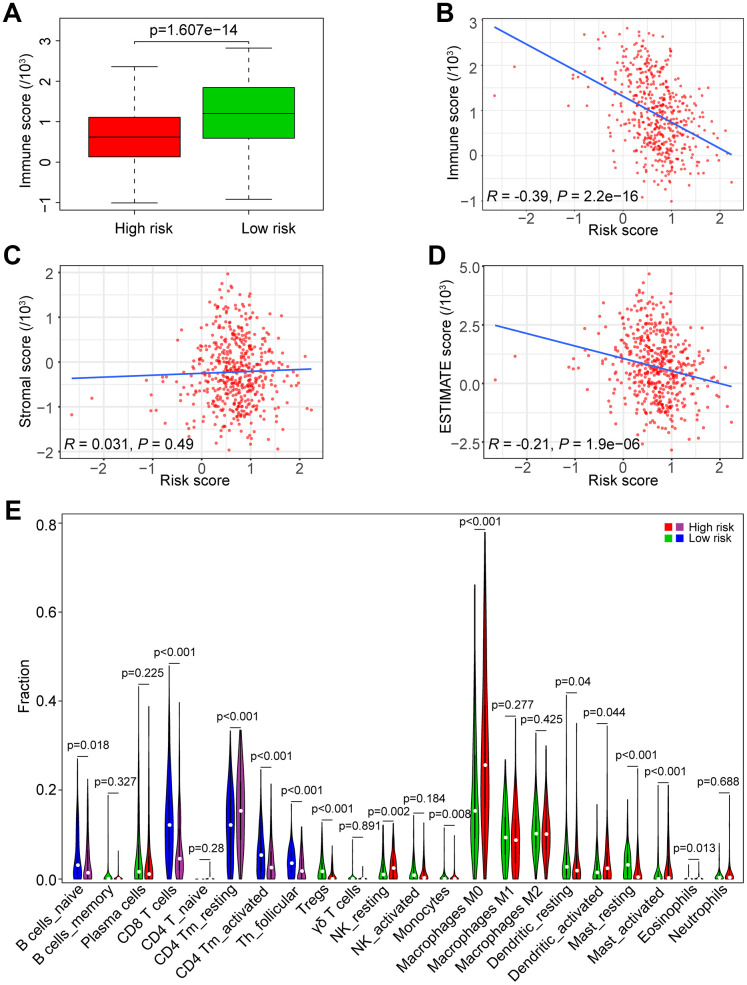
Figure 7.
Association of the risk score with tumor immunity in the TCGA data set. (A) Distribution of immune scores according to the risk score of HNSCC patients. (B) Correlation of the risk score with the immune score in HNSCC samples. (C) Correlation of the risk score with the stromal score in HNSCC samples. (D) Correlation of the risk score with the ESTIMATE score in HNSCC samples. (E) Comparisons of immune cells between the high-risk and low-risk groups.

