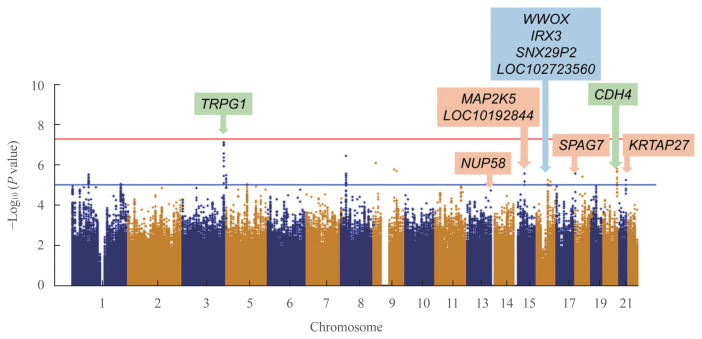
Fig. 1.
Manhattan plot of single nucleotide polymorphisms (SNPs) of the discovery cohort. P values of the y-axis were adjusted for age, sex, and body mass index. Annotated SNPs are significant positions after false discovery rate adjustments. Green, blue, and orange box represents significant SNPs in total study participants, men, and women.

