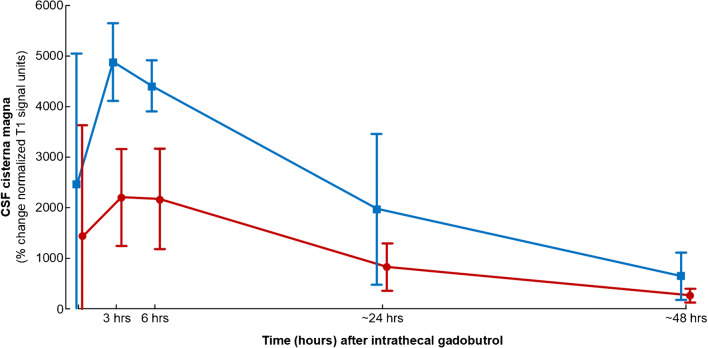
Fig. 3.
CSF tracer enrichment in cisterna magna depending on dose of CSF tracer (gadobutrol), measured as percentage change in normalized T1 signals after intrathecal injection of gadobutrol in doses of 0.5 mmol (protocols #1–2; blue line) or 0.25 mmol (protocol #3; red line). The first time point is after 10 min. The CSF tracer level was significantly different after 3 h (P < 0.001), 6 h (P = 0.001), and 48 h (P = 0.047; independent samples t test).

