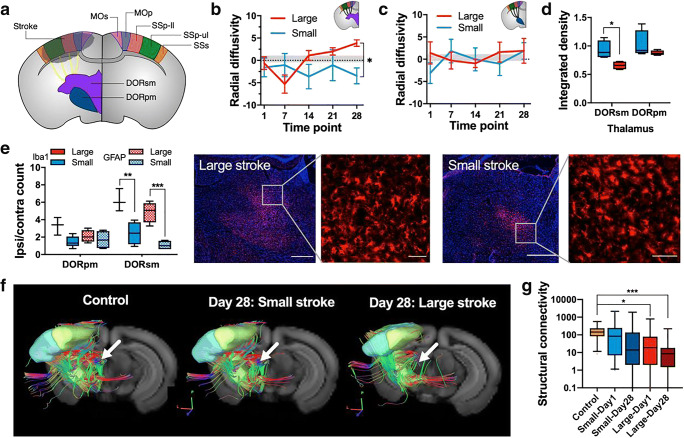
Fig. 3.
Lesion size-dependent secondary degeneration of thalamocortical fiber tracts. a Schematic drawing for the selected thalamocortical fiber tracts between the sensory-motor cortex (MOp, MOs, SSp-ll/−ul, and SSs), the related parts of the thalamus: DORsm and DORpm. b–c Longitudinal diffusion measures for the DORsm and DORpm region expressed as radial diffusivity (RD) [(ipsi-contra)/contra × 100%] for the large (red) and small (blue) strokes groups, respectively, and control values (gray). d Integrated density (which is the ratio ipsilateral/contralateral for the signal intensity normalized to the region size) for DORsm and DORpm regions on T2WI. e Counting results for Iba1+ and GFAP+ cells in the thalamus. Representative immunofluorescence microscopy of a coronal section of the thalamus (red, Iba1 immunostaining; blue, DAPI nuclei counterstain, scale bar 500 μm and 50 μm). f Representative in vivo fiber tracking results for the selected DORsm thalamocortical tract in controls and small/large strokes at day 28. g Differences in average transhemispheric connectivity for the selected contralesional MOp to ipsilesional MOs/MOp/SSp-ll/SSp-ul/SSs cortex pathway for large/small strokes at day one and 28 compared with control. Significant differences between the groups are shown as *p ≤ 0.05, **p ≤ 0.01, and ***p ≤ 0.001, respectively

