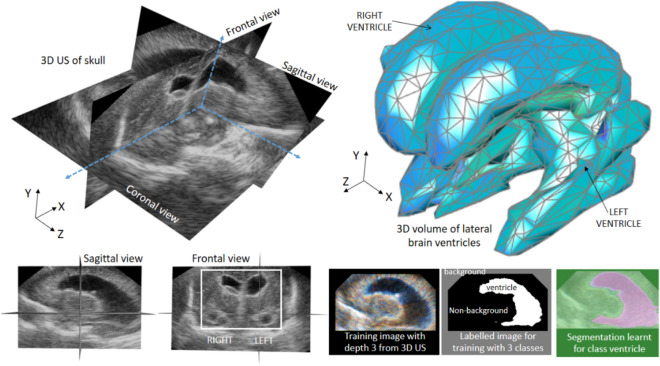
Figure 8.
Left, orthoslice visualization of 3D US of the head of one infant with PHVD. The dilated ventricles are clearly visible. Top right, example of 3D patch surface visualization of the ventricles obtained using deep learning. Bottom left, representative sagittal and coronal slices of one 3D US of one patient with PHVD. Bottom right, representative RGB image generated by stacking three consecutive sagittal slices, the corresponding labels, and the segmentation calculated using a convolutional neural network (CNN).

