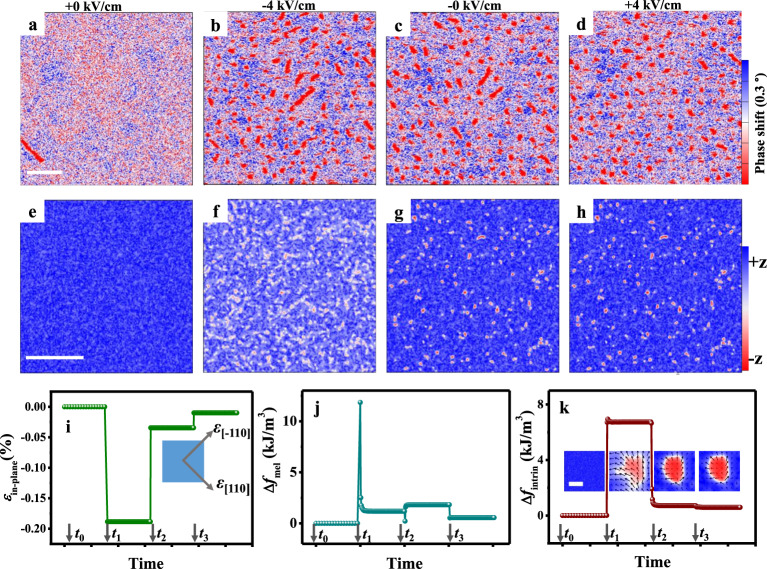
Fig. 3. Skyrmion creation.
MFM images at E = +0 kV/cm (a), −4 kV/cm (b), −0 kV/cm (c), and +4 kV/cm (d) with Bbias = 60 mT. Corresponding simulation results of strain-mediated skyrmion creation with (initial state) and D = 0.772 mJ/m2 (e), and D = 0.585 mJ/m2 (f), and D = 0.685 mJ/m2 (g), and and D = 0.727 mJ/m2 (h), with the blue and red contrasts corresponding to magnetizations pointing up and down, respectively. The scale bar is 1 μm. Evolutions of in-plane biaxial compressive strain (i), magnetoelastic energy density fmel (j), and intrinsic energy density fintrin (k). The time stages are t0 (E = +0 kV/cm), t1 (E = −4 kV/cm), t2 (E = −0 kV/cm), and t3 (E = + 4 kV/cm), respectively. The insets of k are the corresponding individual skyrmion evolutions with a scale bar of 50 nm.

