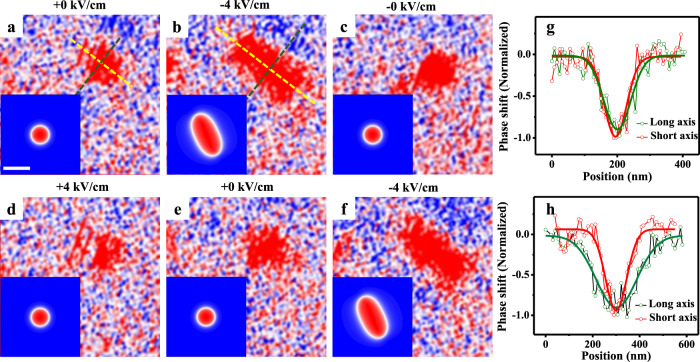
Fig. 4. Skyrmion deformation.
Isolated skyrmion morphology at E = +0 kV/cm (a), −4 kV/cm (b), −0 kV/cm (c), +4 kV/cm (d), +0 kV/cm (e), and −4 kV/cm (f) with Bbias = 55 mT. g, h Skyrmion line-cut profiles along the major and minor axes in a and b with Gaussian fittings (solid lines), respectively. The insets in a–f show the simulation results of strain-mediated deformation of one single skyrmion with D = 0.772 mJ/m2 for +0 kV/cm (a), , , D = 0.585 mJ/m2 for −4 kV/cm (b), D = 0.685 mJ/m2 for −0 kV/cm (c), and D = 0.727 mJ/m2 for +4 kV/cm (d). The scale bar is 100 nm.

