

Graphical abstract

Keywords: Ultrasound, Tannic acid conversion, Gallic acid production, Hydrogen peroxide, Ultrasound conversion, Biomass valorization
Highlights
-
•
Gallic acid production was 128 ± 4 mg g−1 of initial tannic acid using ultrasound with 1 mol L−1 H2O2.
-
•
Reaction time, temperature, horn type, and ultrasound amplitude were evaluated.
-
•
Short reaction time (30 min at 90 °C and atmospheric pressure).
-
•
The proposed process was efficient for the degradation of tannic acid to gallic acid without the use of organic solvents.
Abstract
In this work, ultrasound was applied for the conversion of tannic acid into gallic acid using only diluted H2O2 as reagent. Experiments were carried out using several types of ultrasonic horns operating at 20 kHz (VC750W processor). The following experimental conditions were evaluated: H2O2 concentration (0.2 to 8.5 mol L−1), horn type (10 to 25 mm of diameter), ultrasound amplitude (20 to 70%), sonication time (10 to 45 min), tannic acid concentration (170 to 1360 mg L−1), and reaction temperature (50 to 90 °C). Gallic acid production was monitored with ultra-performance liquid chromatography with high-resolution time-of-flight mass spectrometry (UPLC-ToF-MS). The isolated gallic acid was confirmed with nuclear magnetic resonance (1H and 13C NMR). It is important to emphasize that this study was developed as a proof of concept to demonstrate the potential of ultrasound for tannic acid conversion into gallic acid using just diluted H2O2. Under selected conditions gallic acid production yield was 128 ± 4 mg g−1 of initial tannic acid (using 170 mg L−1 of tannic acid as starting material). Reaction time was set as 30 min, which was carried out using 1 mol L−1 H2O2 and ultrasound amplitude of 50% at 90 °C. At silent conditions (mechanical stirring, from 100 to 1000 rpm), gallic acid production was halved (less than 78 ± 4 mg g−1 of initial tannic acid).
1. Introduction
Tannic acid is defined as a natural biopolymer of high molecular-weight (1701 Da) containing several phenolic groups. It is produced from the secondary metabolism of plants with several phenolic groups in the structure extremities [1], [2]. The main biological functions of tannic acid are associated with protein stabilization and production of insoluble complexes with cellulose and pectin [3]. Tannic acid is employed in beer (organoleptic properties), cosmetic industry (skin treatment), and is considered a potential alternative to the use of petroleum derivatives for the production of industrial resins [4], [5], [6]. It is found in several agro-industrial wastes, such as post-fermentation grape pomace, wood waste, and spent coffee grounds [3].
Despite these applications, tannic acid is a molecule with low-biodegradability rate and its unsuitable waste disposal under uncontrolled conditions can impair human health and ecosystems [7]. When discharged without previous treatment in rivers or lakes, tannic acid can be accumulated in aquatic animals and potentially cause cell death in microorganisms [7], [8], [9], [10]. The presence of tannic acid in potable water causes changes in color, flavor, and odor. It can also form complexes with pesticides, drugs, and elements known to be potentially toxic [8]. Recent studies reported considerable amounts of tannic acid in natural water sources (0.023 mg L−1) and industrial effluents (0.535 mg L−1), which demonstrates the necessity of developing alternative protocols for tannic acid conversion [7], [8], [9], [10], [11].
Some studies have proposed tannic acid conversion based on coagulation, ultrafiltration, and adsorption from industrial effluents [12], [13], [14]. However, the high amount of reagents required, the solid waste generated in the treatments, the low degradability efficiency, and the high costs of implementation are reported as drawbacks for tannic acid conversion [12], [13], [14]. Recently, other authors proposed the use of ultraviolet energy and hydrogen peroxide (H2O2) to complete the conversion of tannic acid from wastewater [15]. The implementation of a photoreactor was considered as a suitable alternative to tannic acid control from wastewater but the long conversion time (180 min) and the relatively high cost for implementation at industrial scale are still challenging.
To overcome the limitations of tannic acid conversion by physical–chemical treatment [12], [13], [14], the use of enzymes has been reported as an alternative for wastewater and effluents [16], [17], [18]. The main enzymatic routes described in the literature suggest the use of Aspergillus and Penicillium strains [16], [17], [18]. When in contact with tannic acid, these microorganisms produce the tannase enzyme (tannin-acyl-hydrolase). This enzyme hydrolyzes the ester group generating glucose and gallic acid as main products [16], [17], [18]. Although tannase enables efficient conversion of tannic acid (higher than 95% in up to 21 days), its action is inhibited by the presence of metals (e.g., Cu, Zn, Fe, Mn, and Mg). Additionally, tannase can be inhibited when in contact with sulfate and chloride species, decreasing the applicability of this route for wastewater treatment [16], [17], [18].
Ultrasound (US) has been applied for many processes, including removal of contaminants, synthesis and extraction from several feedstocks [19], [20], [21]. Ultrasound (ranging from 0.3 to 1 MHz) has been used to develop protocols to convert tannic acid into ellagic acid crystals with no reagent addition [22]. It has been demonstrated that experimental parameters such as US frequency, acoustic density, and sonication time influenced the formation and morphology of crystals of ellagic acid [22]. Although conversion of tannic acid by US could be considered a suitable alternative, there is a lack of studies about the use of this technology for the treatment of effluents, wastes and biomass valorization.
In this work, the potential of ultrasound for tannic acid conversion into gallic acid was evaluated. The experiments were carried out using different types of ultrasonic horns operating at 20 kHz (750 W of nominal power). The following experimental conditions were evaluated: H2O2 concentration, horn type, ultrasound amplitude, sonication time, tannic acid concentration, and temperature. Gallic acid was quantified by ultra-performance liquid chromatography with high-resolution time-of-flight mass spectrometry (UPLC-ToF-MS). The structure of gallic acid was confirmed by nuclear magnetic resonance (1H and 13C NMR). Additional experiments using mechanical stirring were performed for comparison with the proposed US-assisted process.
2. Materials and methods
2.1. Instrumentation
In this work titanium horns with length ranging from 12.7 to 26 cm and diameter from 10 to 25 mm were evaluated using an ultrasonic processor (VC750, Sonics and Materials Inc., USA) operating at 20 kHz with a nominal power of 750 W. The reaction temperature was controlled using a water bath (MCT 110 Plus, Servylab Ltd., Brazil).
Conversion of tannic acid at silent condition was performed using a mechanical stirrer (PT3100 D, Polytron, Switzerland) equipped with a homogenizer tip (20 mm of diameter) operating from 100 to 1000 rpm.
Gallic acid was identified and quantified using an AcquityTM UPLC system from Waters Corp. (USA). Separation was performed in a HSS T3 column (2.1 × 50 mm, 1.8 µm, Waters) coupled to a time-of-flight mass spectrometer (Xevo G2 Q-Tof, Waters), equipped with an electrospray ionization source (ESI). Mass spectra were acquired from 50 to 1000 Da. The ESI-ToF-MS detection was performed in negative ion mode with capillary voltage of 2.00 kV, cone voltage of 20 V, and extractor cone voltage of 2.00 V. Desolvation gas and cone gas flow rate were 400 L h−1 and 100 L h−1, respectively. Desolvation temperature was set to 400 °C and source temperature was 150 °C. System control and data acquisition were performed using MassLynx V 4.1 software.
Gallic acid structure was confirmed using 1H and 13C NMR analyses. The NMR spectra were acquired using 150.92 and 600.13 MHz for 13C and 1H, respectively. Spectra were recorded on a Bruker Avance III NMR spectrometer with 64 scans and were processed using Bruker-Topspin software.
2.2. Reagents
Distilled and deionized water was purified using a model Milli-Q system (Millipore, USA). Tannic acid (94%), gallic acid (98%), H2O2 (30%) and ethyl acetate (98%) were obtained from Sigma (Sigma-Aldrich, Germany). Acetonitrile (99%) and methanol (99%) used in UPLC-ESI-ToF-MS were purchased from Fluka (Germany) and Tedia (USA), respectively. Nitrogen and argon (purity of 99.999% and 99.998% respectively, White Martins, Brazil) were used as collision gas in UPLC-ESI-ToF-MS.
2.3. Methods
The proposed process was carried out in a glass cylindrical reactor with 5 cm of internal diameter and 20 cm of height. Initial experiments were arbitrarily performed using 170 mg L−1 tannic acid at 50 °C, 30 min, and 50% acoustic amplitude. Tannic acid was transferred to the reactor with 20 mL diluted H2O2. The US horns were immersed in the reaction mixture at 3 cm from the bottom of the reactor in all experiments using US.
A univariate design was proposed to optimize the experimental conditions for tannic acid conversion into gallic acid. The following experimental parameters were evaluated: H2O2 concentration (0.2 to 8.5 mol L−1), horn type (10 to 25 mm of diameter), ultrasound amplitude (20 to 70%), sonication time (10 to 45 min), tannic acid concentration (170 to 1360 mg L−1), and the reaction temperature (50 to 90 °C).
Acoustic density was determined by calorimetry, according to previous works [23], [24]. These experiments were performed using an ultrasonic horn or mechanical stirrer with 170 mg L−1 of tannic acid, 20 mL of 1 mol L−1 H2O2 and 5 min. Temperature was monitored using a digital thermometer and the acoustic density was calculated in W cm−3.
Prior to chromatographic analyses, all samples were filtered using a polytetrafluoroethylene filter (0.22 µm), and diluted in methanol. Chromatographic separation was achieved with an acquity HSS T3 column (50 xx 2.1 mm, 1.8 µm) with a mobile phase consisting of (A) aqueous solution containing 0.1% (v/v) formic acid, and (B) methanol. A gradient elution was used as follows: 0 min – 5% B; 0.5 min – 20% B; 7.0 min – 50% B; 11.0 min – 80% B; 11.5 min – 100% B; 13.0 min – 5% B. Flow-rate was set at 0.3 mL min−1 and the total chromatographic run time was 15 min. Injection volume was 5 µL and the column temperature was set at 40 °C. The MS parameters were optimized by infusion of individual gallic acid and tannic acid solutions directly into the mass spectrometer. The chromatogram and spectrum are presented in Fig. S1 (Appendix A. Supplementary data).
For gallic acid analysis by NMR, liquid–liquid extraction was carried out using ethyl acetate, followed by solvent evaporation at reduced pressure [25].
3. Results and discussion
3.1. Influence of H2O2
Different H2O2 concentrations (0.2 to 8.5 mol L−1) were evaluated, as the gallic acid production and reaction selectivity are dependent on this parameter. In this study, 20 mL of tannic acid solution (170 mg L−1) containing H2O2 were submitted to US-assisted process. The experiments were performed using an ultrasonic horn (length of 26 cm and diameter of 15 mm) operating at 20 kHz. Ultrasound amplitude was set at 50% and it was applied at controlled temperature (50 °C) for 30 min. Gallic acid production was estimated by UPLC-ToF-MS (Fig. 1).
Fig. 1.
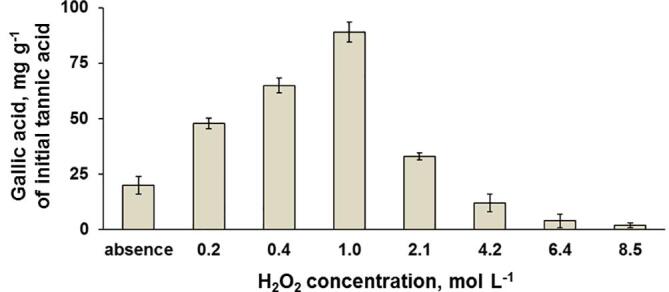
Effect of H2O2 concentration on the gallic acid production from tannic acid. Experimental conditions: ultrasonic horn operating at 20 kHz with 50% acoustic amplitude, and 20 mL of 170 mg L−1 tannic acid at 50 °C for 30 min (error bars represent standard deviation, n = 3).
The conversion to gallic acid increased while H2O2 concentration increased up to 1 mol L−1. When H2O2 concentration higher than 1 mol L−1 was used, a significant decrease in gallic acid production was observed, which is associated to further oxidation of starting material. For these conditions, the MS spectrum showed a significant signal intensity for pyrogallol (Appendix A. Supplementary data – Fig. S2). When experiments were carried out in the absence of H2O2, gallic acid production was as low as 20 mg g−1 of initial tannic acid (4 times lower than when using 1 mol L−1 H2O2), which demonstrates the role of H2O2 in the proposed process. Thus, 1 mol L−1 H2O2 was selected as the most suitable condition in order to evaluate the influence of other experimental parameters.
3.2. Influence of horn type and amplitude of US
The horn type is an important aspect for the optimization of the proposed process. In the US system used in this work, the horn is responsible for the transmission of the mechanical wave to the liquid medium and, in some conditions, the magnification of the mechanical vibration produced by US transducer [26], [27]. Depending on the selected horn type, the energy delivered to the solution can be modified [26], [27]. This parameter is directly associated with the acoustic density in the reaction medium, which can change the sonochemistry taking place and thus, gallic acid production. In this study, 20 mL of tannic acid solution (170 mg L−1) containing 1 mol L−1 H2O2 were sonicated. The experiments were performed using an ultrasonic horn operating at 20 kHz (50% acoustic amplitude) for 30 min at controlled temperature (50 °C). The results obtained for all the evaluated horn types are shown in Fig. 2a.
Fig. 2.

Dependence of gallic acid production by using (a) horn type (diameter × length) and (b) amplitude of US. Experimental conditions: ultrasonic horn operating at 20 kHz and 20 mL of tannic acid solution (170 mg L−1) containing 1 mol L−1 H2O at 50 °C for 30 min (error bars represent standard deviation, n = 3).
When the horn type was evaluated (Fig. 2a), gallic acid production ranged from 15 to 91 mg g−1 of initial tannic acid. The most suitable length and diameter of US horn were 26 cm and 15 mm, respectively. The acoustic density ranged from 0.4 to 13 W cm-3, which enabled an effective mass transfer and increased the interaction between tannic acid and hydroxyl radicals produced from H2O2 degradation. Based on this result, the ultrasonic horn with 26 cm of length and 15 mm of diameter was selected for further evaluations.
This ultrasonic horn (26 cm × 15 mm) was used for evaluating the influence of acoustic amplitude on the gallic acid production. The acoustic amplitude was varied from 20 up to 70% (30 min of sonication at50 °C), and the average ultrasonic power delivered to the solution was determined through calorimetry. Tannic acid solution (20 mL,170 mg L−1) was sonicated considering previously optimized conditions (1 mol L−1 H2O2). The effect of US amplitude on gallic acid production is shown in Fig. 2b.
When 50% acoustic amplitude was applied, gallic acid production was about 91 ± 3 mg g−1 of initial tannic acid and remained constant (considering a p-value of 0.05) for higher acoustic amplitudes (60 and 70%). For lower amplitude values (20 to 40%), gallic acid production was reduced to half this value (51 ± 4 mg g−1 of initial tannic acid), demonstrating the influence of acoustic density in the proposed process.
Regarding energy consumption, increasing the amplitude from 20 to 70%, the average ultrasonic power delivered to the horn was increased from 11.5 kJ to 183.6 kJ. The US amplitude was selected based on the relationship between gallic acid production and energy saving condition. Hence, the amplitude of 50% was chosen for subsequent experiments.
3.3. Influence of tannic acid concentration, time and temperature
After evaluating the H2O2 concentration (1 mol L−1), horn type (26 cm × 15 mm), and ultrasound amplitude (50%), the evaluation of the initial tannic acid concentration (170 to 1360 mg L−1), sonication time (10 to 45 min), and reaction temperature (50 to 90 °C) was carried out. The obtained results are presented in Fig. 3.
Fig. 3.
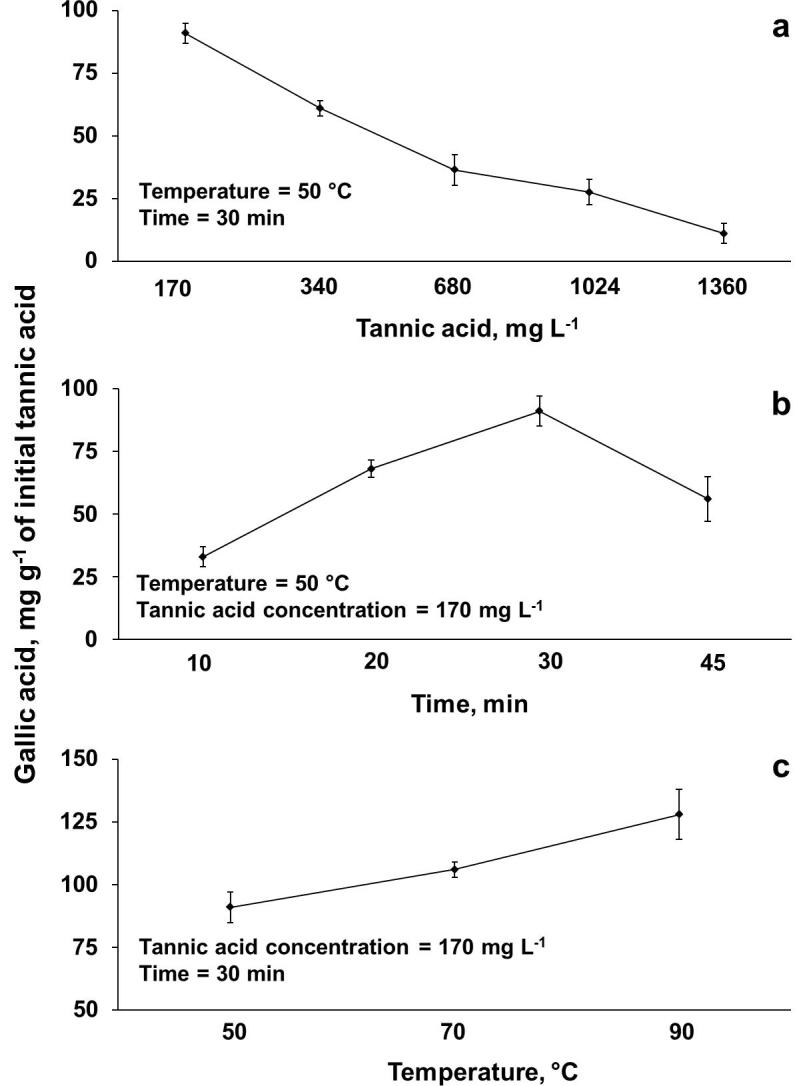
Dependence of gallic acid production:(a) tannic acid concentration, (b), sonication time, and (c) reaction temperature. Experimental conditions: ultrasonic horn (length of 26 cm x and diameter of x 15 mm) operating at 20 kHz with 750 W of nominal power andand 50% of amplitude,and 20 mL of tannic acid solution containing 1 mol L−1 H2O2 (error bars represent standard deviation, n = 3).
As was expected, an increase in the initial tannic acid concentration resulted in a reduction of gallic acid production from 91 to 11 mg g−1 of initial tannic acid (using 1 mol L−1 H2O2). At lower concentration,170 mg L−1, tannic acid is easily solubilized, increasing its conversion rate. As initial tannic acid mass increases, the solubilization process starts to impair the reaction rate. In other words, part of the US energy is consumed for the solubilization of tannic acid in this condition. Hence, when using lower tannic acid concentrations, most of the US delivered energy is available for the fragmentation of the tannic acid structure, which enables an increment in the gallic acid production. Based on this result, 170 mg L−1 of tannic acid was selected for further evaluations.
The sonication time was also evaluated, from 10 to 45 min, as it is possible to observe in Fig. 3b. After 30 min of sonication, gallic acid production reached approximately 91 ± 3 mg g−1 of initial tannic acid. Further increase in sonication time (45 min) resulted in a decrease of gallic acid production (56 ± 4 mg g−1 of initial tannic acid), due to further oxidation, as evidenced by the significant increase in signal intensity for pyrogallol in the MS spectrum (Appendix A. Supplementary data – Fig. S3). For sonication times lower than 30 min, lower gallic acid productions were achieved (33 and 68 mg g−1 of initial tannic acid) for 10 and 20 min, respectively. Thus, the sonication time of 30 min was chosen for further experiments.
The increase in reaction temperature from 50 to 90 °C (Fig. 3c) resulted in an improvement in reaction rate and gallic acid production (from 91 to 128 mg g−1 of initial tannic acid). In addition, H2O2 conversion was also increased, liberating more hydroxyl radicals and consequently increasing gallic acid production. The obtained gallic acid was separated from the reaction medium using liquid–liquid extraction with ethyl acetate and subsequent solvent evaporation at reduced pressure [25]. The efficiency of these procedures for the isolation of gallic acid was confirmed by 1H and 13C NMR analysis (Figs. S4 and S5, Appendix A. - Supplementary data).
3.4. Evaluation of gallic acid production at silent conditions
In order to evaluate the effects of US on gallic acid production, experiments using only mechanical stirring (silent condition) were carried out using the optimized conditions. The reaction took place in the absence of US, and mechanical stirring was varied from 100 to 1000 rpm. The results for gallic acid production at silent conditions are shown in Fig. 4.
Fig. 4.

Gallic acid production at silent conditions (using mechanical stirring). Experimental conditions: 20 mL of 170 mg L−1 tannic acid solution containing 1 mol L−1 H2O2 for 30 min at 90 °C (error bars represent standard deviation, n = 3).
When applying only mechanical stirring, gallic acid production was below 78 ± 5 mg g−1 of initial tannic acid for all evaluated rotation speeds. The reduction in gallic acid production can be attributed to the lower energy which the reaction mixture was exposed to by mechanical stirring only. When US was applied, an acoustic density of about 13 W cm−3 was obtained by calorimetry, while for mechanical stirring, the values were lower than 0.4 W cm−3.
As it is reported in literature, a frequency range of US between 300 and 500 kHz is considered as ideal for the production of ∙OH and ∙H radicals by homolytic cleavage of water molecules. The formed radicals can contribute for the hydrolysis of ester linkage, C–C coupling reactions, and condensation reactions [22], [28].
However, as it was observed in the present study, the increase of H2O2 concentration also increased the tannic acid degradation rates, which might be associated to radical attack. Although the used frequency (20 kHz) is not considered ideal for radical production, the use of H2O2 probably contributed to the formation of reactive species [29]. Additionally, the mechanic effects associated with the strong shear forces, as well as the extreme conditions of temperature and pressure gradients upon bubble collapse at low frequency US (20 kHz), could significantly increase the degradation rate of the tannic acid into gallic acid. The obtained results, combined with the evidences about dependency on the horn type, and US amplitude for an efficient gallic acid production, makes it possible to infer that US has contributed to the production of gallic acid, showing a synergistic effect when combined to H2O2.
4. Conclusion
The proposed process was considered a promising alternative for tannic acid conversion into gallic acid using only diluted H2O2 and US energy. The US horn (20 kHz and 750 W of nominal power) enables higher gallic acid production when compared to those obtained when using only mechanical stirring, showing an increase as high as 64% when using the optimized conditions. Using 170 mg L−1 of tannic acid with 1 mol L−1 H2O2, amplitude of 50%, at 90 °C and 30 min, a gallic acid production of 128 ± 4 mg g−1 of initial tannic acid was achieved. The main advantages of the proposed treatment were: i) use of diluted solutions, ii) relatively low sonication time, iii) reactor operating at atmospheric pressure, and iv) no need for organic solvents.
Declaration of Competing Interest
The authors declare that they have no known competing financial interests or personal relationships that could have appeared to influence the work reported in this paper.
Acknowledgements
The authors are grateful to Conselho Nacional de Desenvolvimento Científico e Tecnológico (CNPq, Grant nr. 309549/2016-7, 309297/2016-8, 313786/2019-4) and Fundação de Amparo à Pesquisa do Estado do Rio Grande do Sul (FAPERGS, Grant nr. 16/2551-0000226-6) for supporting this study. This study was partly financed by the Coordenação de Aperfeiçoamento de Pessoal de Nível Superior – Brasil (CAPES) - Finance code 001.
Footnotes
Supplementary data to this article can be found online at https://doi.org/10.1016/j.ultsonch.2020.105442.
Appendix A. Supplementary data
The following are the Supplementary data to this article:
References
- 1.Mueller-Harvey I. Analysis of hydrolyzable tannins. Animal Feed Sci. Tech. 2001;91:3–20. doi: 10.1016/S0377-8401(01)00227-9. [DOI] [Google Scholar]
- 2.Pouységu L., Deffieux D., Malik G., Natangelo A., Quideau S. Synthesis of ellagitannin natural products. Nat. Prod. Rep. 2011;28(5):853. doi: 10.1039/c0np00058b. [DOI] [PubMed] [Google Scholar]
- 3.Bele A.A., Jadhav V.M., Kadam V.J. Potential of tannins: A review. Asian J. Plant Sci. 2010;209:209–214. doi: 10.3923/ajps.2010.209.214. [DOI] [Google Scholar]
- 4.Mercedes Lataza Rovaletti M., Benítez E.I., Martinez Amezaga N.M.J., Peruchena N.M., Sosa G.L., Lozano J.E. Polysaccharides influence on the interaction between tannic acid and haze active proteins in beer. Food Res. Int. 2014;62:779–785. doi: 10.1016/j.foodres.2014.03.017. [DOI] [Google Scholar]
- 5.Fathima N.N., Rathinam A., Raghava J., Nair B.U. Tannic acid-phosphonium combination: a versatile chrome-free organic tanning. J. Am. Leather Chem. Assoc. 2006;101:161–168. [Google Scholar]
- 6.Tondi G. Tannin-based copolymers resins: synthesis and characterization by solid state 13C NMR and FTIR spectroscopy. Polymers. 2017;223:1–17. doi: 10.3390/polym9060223. [DOI] [PMC free article] [PubMed] [Google Scholar]
- 7.Xie C., Cui H. Detection of tannic acid at trace level in industrial wastewaters using a highly sensitive chemiluminescence method. Water Res. 2003;37(1):233–237. doi: 10.1016/S0043-1354(02)00247-6. [DOI] [PubMed] [Google Scholar]
- 8.Kronberg S.L. Sheep Ingestion of Water Containing Quebracho or Black Wattle Tannin. Rangeland Ecol. Manage. 2010;63(2):258–262. doi: 10.2111/08-254.1. [DOI] [Google Scholar]
- 9.Ates N., Kaplan S.S., Sahinkaya E., Kitis M., Dilek F.B., Yetis U. Occurrence of disinfection by-products in low DOC surface waters in Turkey. J. Hazard. Mater. 2007;142(1-2):526–534. doi: 10.1016/j.jhazmat.2006.08.076. [DOI] [PubMed] [Google Scholar]
- 10.Philippe K.K., Hans C., MacAdam J., Jefferson B., Hart J., Parsons S.A. Photocatalytic oxidation of natural organic matter surrogates and the impact on trihalomethane formation potential. Chemosphere. 2010;81(11):1509–1516. doi: 10.1016/j.chemosphere.2010.08.035. [DOI] [PubMed] [Google Scholar]
- 11.Deng Y., Wang L., Hu X., Liu B., Wei Z., Yang S., Sun C. Highly efficient removal of tannic acid from aqueous solution by chitosan-coated attapulgite. Chem. Eng. J. 2012;181-182:300–306. doi: 10.1016/j.cej.2011.11.082. [DOI] [Google Scholar]
- 12.Zhou Y., Xing X.-H., Liu Z., Cui L., Yu A., Feng Q., Yang H. Enhanced coagulation of ferric chloride aided by tannic acid for phosphorus removal from wastewater. Chemosphere. 2008;72(2):290–298. doi: 10.1016/j.chemosphere.2008.02.028. [DOI] [PubMed] [Google Scholar]
- 13.Cañizares P., Pérez Á., Camarillo R., Llanos J. Tannic acid removal from aqueous effluents using micellar enhanced ultrafiltration at pilot scale. Desalination. 2006;200(1-3):310–312. doi: 10.1016/j.desal.2006.03.326. [DOI] [Google Scholar]
- 14.Vinod V.P, Anirudhan T.S. Sorption of tannic acid on zirconium pillared clay. J. Chem. Technol. Biotechnol. 2002;77(1):92–101. doi: 10.1002/jctb.530. [DOI] [Google Scholar]
- 15.Bensalah N., Chair K., Bedoui A. Efficient conversion of tannic acid in water by UV/H2O2 process. Sustain. Environ. Res. 2018;28:1–11. doi: 10.1016/j.serj.2017.04.004. [DOI] [Google Scholar]
- 16.Govindarajan R.K., Revathi S., Rameshkumar N., Krishnan M., Kayalvizhi N. Microbial tannase: Current perspectives and biotechnological advances. Biocatal. Agric. Biotech. 2016;6:168–175. doi: 10.1016/j.bcab.2016.03.011. [DOI] [Google Scholar]
- 17.Aharwar A., Parihar D.K. Tannases: Production, properties, applications. Biocatal. Agric. Biotech. 2018;15:322–334. doi: 10.1016/j.bcab.2018.07.005. [DOI] [Google Scholar]
- 18.Sharma K.P. Tannin degradation by phytopathogen's tannase: A Plant's defense perspective. Biocatal. Agric. Biotech. 2019;21:101342. doi: 10.1016/j.bcab.2019.101342. [DOI] [Google Scholar]
- 19.Gatiboni T.L., Iop G.D., Diehl L.O., Flores E.M.M., Muller E.I., Mello P.A. An ultrasound-assisted sample preparation method of carbonatite rock for determination of rare earth elements by inductively coupled plasma mass spectrometry. Rapid Commun. Mass Spectrom. 2020;8732:8732. doi: 10.1002/rcm.8732. [DOI] [PubMed] [Google Scholar]
- 20.Bizzi C.A., Zanatta R.C., Santos D., Giacobe K., Dallago R.M., Mello P.A., Flores E.M.M. Ultrasound-assisted extraction of chromium from residual tanned leather: An innovative strategy for the reuse of waste in tanning industry. Ultrason. Sonochem. 2020;64 doi: 10.1016/j.ultsonch.2019.104682. [DOI] [PubMed] [Google Scholar]
- 21.Bizzi C.A., Santos D., Sieben T.C., Motta G.V., Mello P.A., Flores E.M.M. Furfural production from lignocellulosic biomass by ultrasound-assisted acid hydrolysis. Ultrason. Sonochem. 2019;51:332–339. doi: 10.1016/j.ultsonch.2018.09.011. [DOI] [PubMed] [Google Scholar]
- 22.Bhangu S.K., Singla R., Colombo E., Ashokkumar M., Cavalieri F. Sono-transformation of tannic acid into biofunctional ellagic acid micro/nanocrystals with distinct morphologies. Green Chem. 2018;20(4):816–821. doi: 10.1039/C7GC03163G. [DOI] [Google Scholar]
- 23.Koda S., Kimura T., Kondo T., Mitome H. A standard method to calibrate sonochemical efficiency of an individual reaction system. Ultrason. Sonochem. 2003;10(3):149–156. doi: 10.1016/S1350-4177(03)00084-1. [DOI] [PubMed] [Google Scholar]
- 24.Kimura T., Sakamoto T., Leveque J.M., Sohmiya H., Fujita M., Ikeda S., Ando T. Standardization of ultrasonic power for sonochemical reaction. Ultrason. Sonochem. 1996;3:S157–S161. doi: 10.1016/S1350-4177(96)00021-1. [DOI] [Google Scholar]
- 25.Zhang Q.-A., Shen H., Fan X.-H., Shen Y., Wang X.i., Song Y. Changes of gallic acid mediated by ultrasound in a model extraction solution. Ultrason. Sonochem. 2015;22:149–154. doi: 10.1016/j.ultsonch.2014.06.010. [DOI] [PubMed] [Google Scholar]
- 26.Chen D., Sharma S.K., Mudhoo A. first ed. CRC Press; Boca Raton: 2012. Handbook on applications of ultrasound: Sonochemistry for sustainability. [Google Scholar]
- 27.Ashokkumar M., Cavalieri F., Chemat F., Okitsu K., Sambandam A., Yasui K., Zisu B. first ed. Springer; Berlim: 2016. Handbook of Ultrasonics and Sonochemistry. [Google Scholar]
- 28.Cravotto G., Cintas P. Harnessing mechanochemical effects with ultrasound-induced reactions. Chem. Sci. 2012;3(2):295–307. doi: 10.1039/C1SC00740H. [DOI] [Google Scholar]
- 29.McKenzie T.G., Karimi F., Ashokkumar M., Qiao G.G. Ultrasound and sonochemistry for radicals polymerization sound synthesis. Chem. Eur. J. 2019;25:1–18. doi: 10.1002/chem.201803771. [DOI] [PubMed] [Google Scholar]
Associated Data
This section collects any data citations, data availability statements, or supplementary materials included in this article.