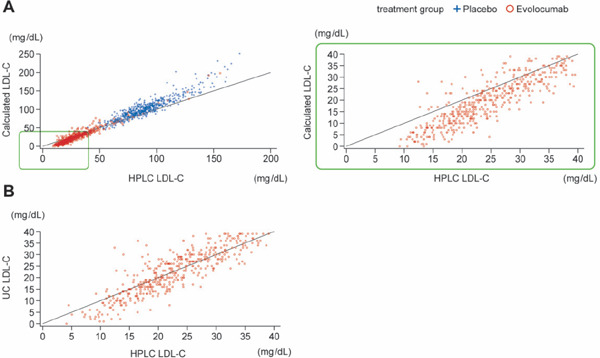
Fig. 4.

Accuracy in monitoring low LDL-C concentrations using high-performance liquid chromatography (HPLC)
Fig. 4A consists of two graphs. Left: scatter plot of calculated LDL-C and HPLC LDL-C values for all post-baseline scheduled visits by placebo or evolocumab treatment group. Patient population is the full analysis set. The lower left corner segment, outlined in green, represents blood samples having calculated LDL-C values less than 40 mg/dL and HPLC LDL-C values less than 40 mg/dL. That segment is expanded in the scatter plot on the right.
Fig. 4B consists of a scatter plot of UC LDL-C and HPLC LDL-C values for all post-baseline scheduled visits by placebo or evolocumab treatment group and represents blood samples having UC LDL-C values less than 40 mg/dL and HPLC LDL-C values less than 40 mg/dL. Patient population is the full analysis set.
All plots were based on observed data. Missing values were not imputed.
Abbreviations: LDL-C, low-density lipoprotein cholesterol; UC, ultracentrifugation.
