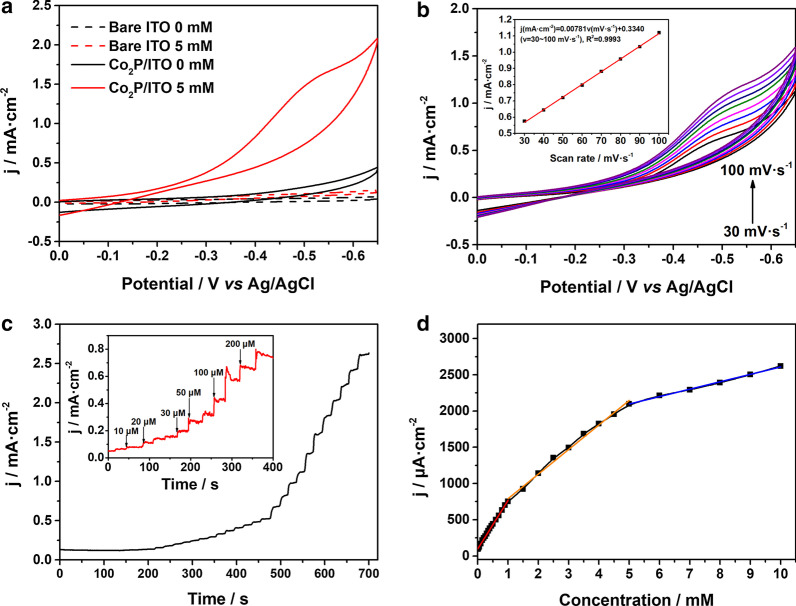
Fig. 2.
a CV curves of bare ITO and Co2P/ITO electrode in 0.1 M PBS with and without 5.0 mM H2O2 at a scan rate of 100 mV s−1. b CV curves of Co2P/ITO electrode in 2.5 mM H2O2 at scan rates from 30 to 100 mV s−1. Inset: The corresponding plot of current versus the scan rate. c Amperometric responses of Co2P/ITO electrode with successive addition of H2O2 in 0.1 M PBS. d The calibration curve of steady current versus the concentration of H2O2

