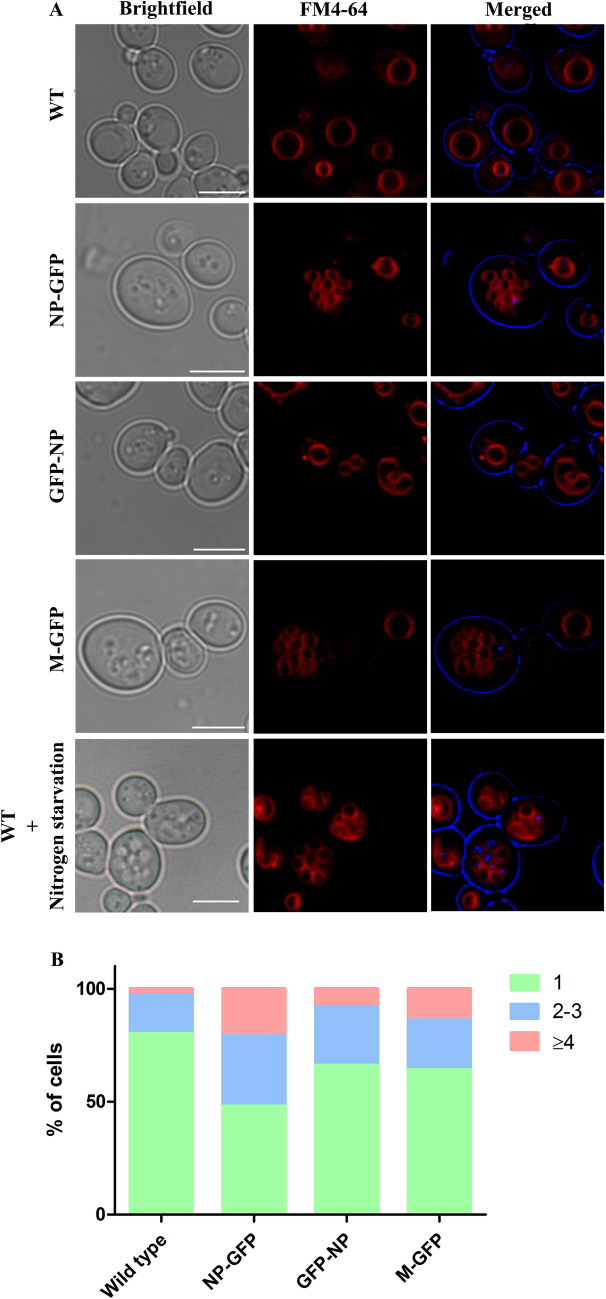
Fig. 5.
Effect of expression of NP-GFP, GFP-NP and M-GFP on vacuoles in yeast. WT, NP-GFP, GFP-NP and M-GFP expressing cells were grown in YND media and stained with FM4-64 (1 μg/μl) to mark vacuoles and samples were subsequently analyzed by confocal microscopy. WT cells grown in nitrogen starvation medium are also depicted in the last panel. The corresponding bright field image is shown in each panel. Scale bar represents 5 µm. The graph represents percentage of cells with 1, 2–3 and 4 or > 4 vacuoles

