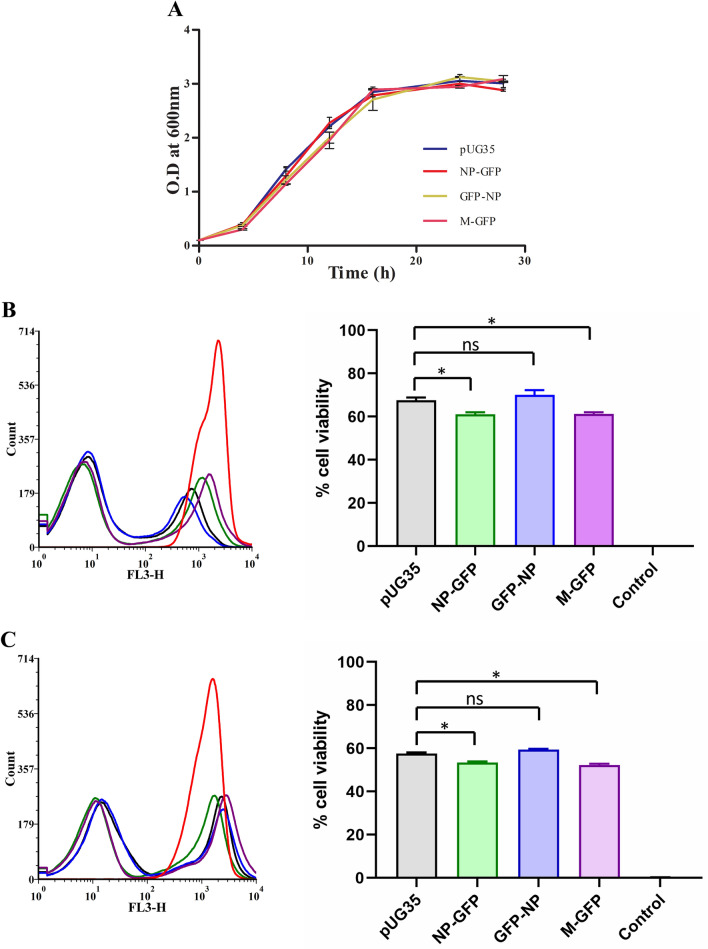
Fig. 6.
Effect of expression of NP and M proteins on cell growth and viability. The effect of expression of NP and M proteins on yeast growth was assessed by plotting a growth curve. Cell growth was measured spectrophotometrically at OD 600 over the indicated time (a). Cell viability was analyzed quantitatively by flow cytometry of cells cultured for 24 (b) and 48 h (c). Cells expressing the viral proteins and empty vector were stained with PI for the analysis. A sample containing cells killed by heat shock (95 °C, 5 min) was used as a control (PC) for PI staining. Quantitative data obtained from flow cytometry is depicted as histograms and % cell viability as bar graphs. Error bars show the absolute deviations from the mean value. Significance was determined using one-way ANOVA. Values of p > 0.05 were considered nonsignificant (ns), p < 0.05 were considered significant (*)

