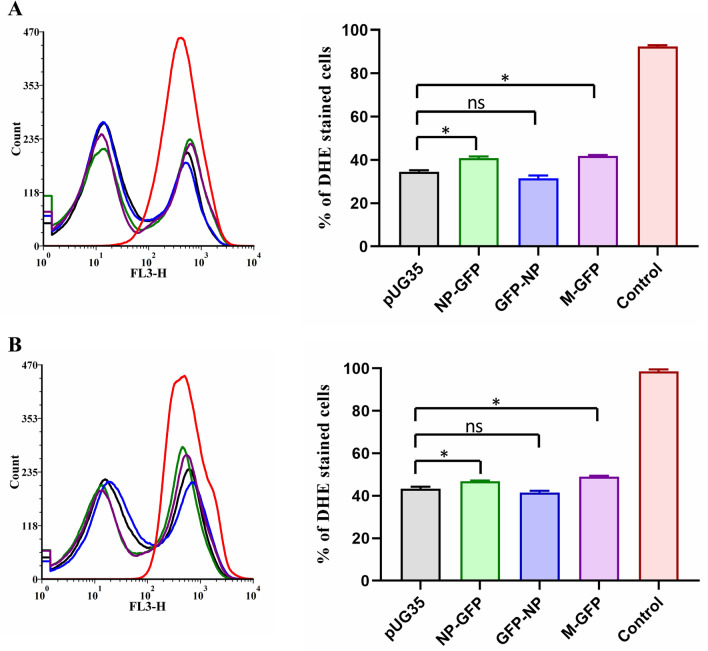
Fig. 7.
Effect of expression of NP and M proteins on oxidative stress. To assess the oxidative stress, cells cultured for 24 and 48 h were stained with DHE and analyzed by flow cytometry (a, b). ctt1 cells were taken as a control (PC). Quantitative data obtained from flow cytometry are depicted as histograms and % DHE stained cells as bar graphs. Error bars show the absolute deviations from the mean value. Significance was determined using one-way ANOVA. Values of p > 0.05 were considered nonsignificant (ns); those of p < 0.05 were considered significant (*)

