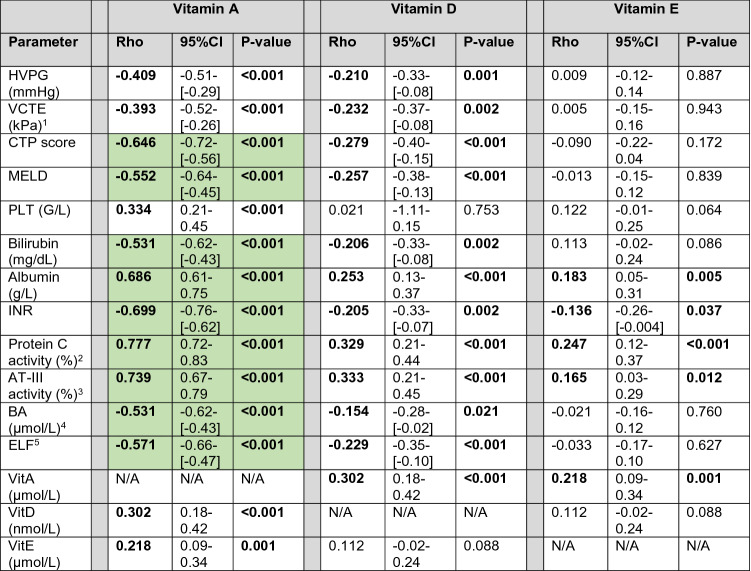
Table 1.
Correlation of Vitamin A, D, and E serum levels with hemodynamic and laboratory parameters
p values < 0.05 are indicated in bold. Correlation coefficients > 0.500/ < − 0.500 are indicated in bold and highlighted in green
HVPG hepatic venous pressure gradient, CTP Child-Turcotte-Pugh, VCTE vibration-controlled transient elastography, MELD Model for end-stage liver disease, PLT platelet count, VitA vitamin A, VitD vitamin D, VitE vitamin E, INR international normalized ratio, AT-III antithrombin III, BA bile acids, ELF enhanced liver fibrosis score
1Reliable VCTE results were available in N = 174 (74.4%) patients
2Protein C activity was available in N = 229 (97.9%) patients
3AT-III activity was available in N = 230 (98.3%) patients
4Bile acid serum levels were available in N = 224 (95.7%) patients
5ELF score was available in N = 219 (93.6%) patients

