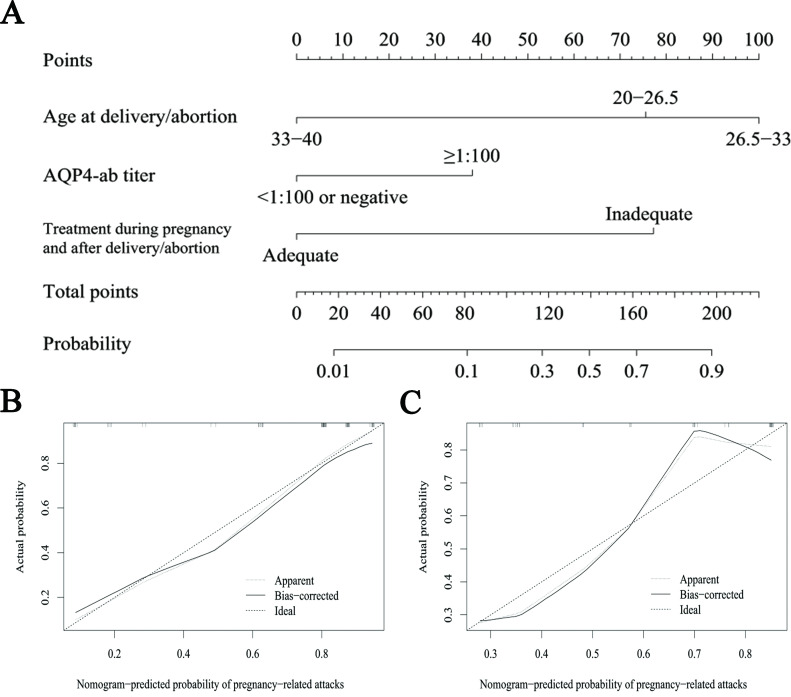
Figure 3.
The prediction model of pregnancy-related attacks. (A) Nomogram for predicting the probability of pregnancy-related attacks. An individual patient’s value was based on each variable axis of the nomogram, and the number of points obtained for each variable value was determined with a line drawn upward. The sum of the points is located at the total points axis, which corresponds to the probability of pregnancy-related attacks in downward-pointing line. (B) The calibration curve for predicting the probability of pregnancy-related attacks in the primary cohort. (C) The calibration curve for predicting the probability of pregnancy-related attacks in the validation cohort. AQP4-ab, aquaporin-4 antibody.

