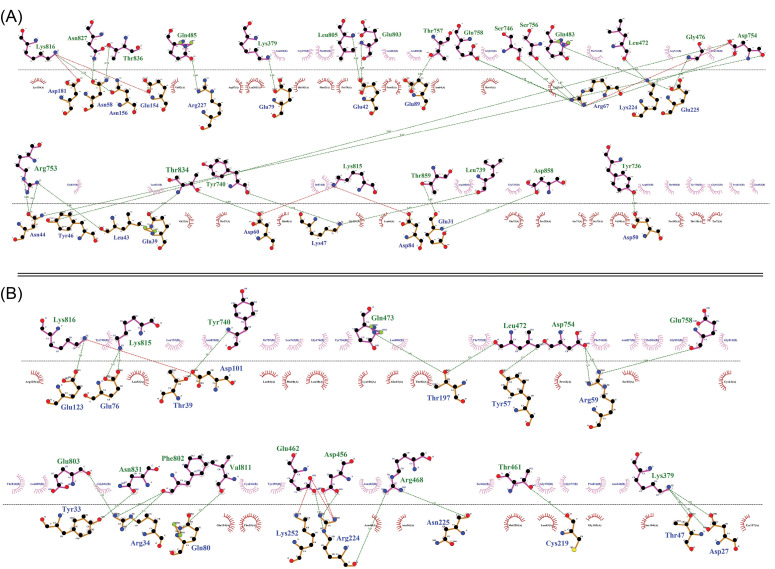
Fig. 8.
The two-dimensional diagram of the vaccine-receptor docked complexes. Intramolecular interactions between the vaccine-TLR4 (A) and vaccine-TLR5 (B). The hydrogen bonds and hydrophobic interactions are shown as a green dashed line, and a red spline curve, respectively. The intermolecular bonds of the vaccine and TLRs are shown as purple and brown lines, respectively. The plots provided by the DIMPLOT tool of LigPlot+ v2.2 program.70

