Fig. 2.

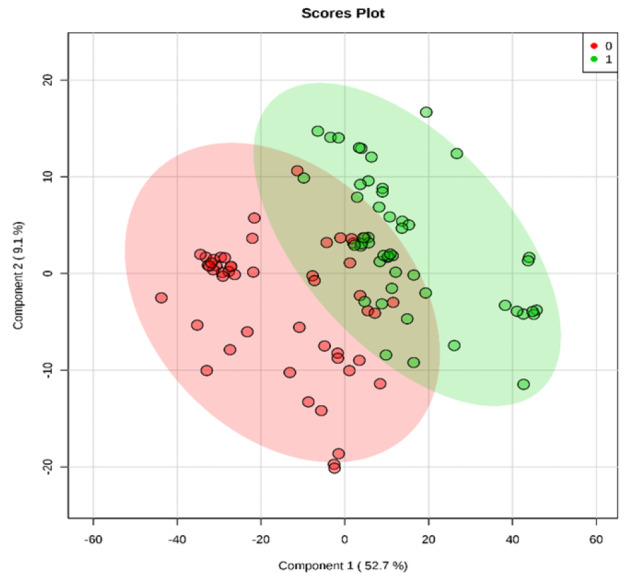
PLS-DA Score Plot for Patients and Healthy Volunteers using the 11 identified differential metabolites. Red plots represent the CRC patients and green plots represent normal controls.

PLS-DA Score Plot for Patients and Healthy Volunteers using the 11 identified differential metabolites. Red plots represent the CRC patients and green plots represent normal controls.