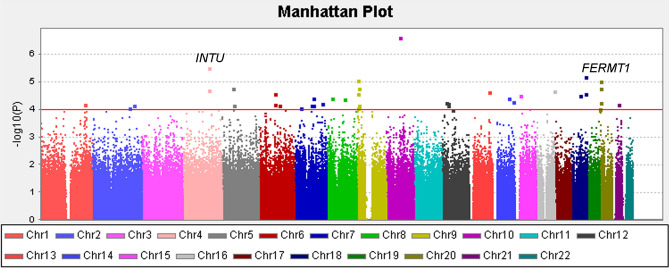
Figure 2.
Manhattan plot of endometriosis. Results of genome-wide association analysis (− log10 P) presented in chromosomal order for 620,465 SNPs tested for association in 126 endometriosis and 96 non-endometriosis control. The x axis shows each of the SNPs used in the discovery phase. The y axis shows the − log10 P value of the trend test. Signals in inturned planar cell polarity protein (INTU) and fermitin family member 1 (FERMT1) loci are also presented. SNP single nucleotide polymorphism.

