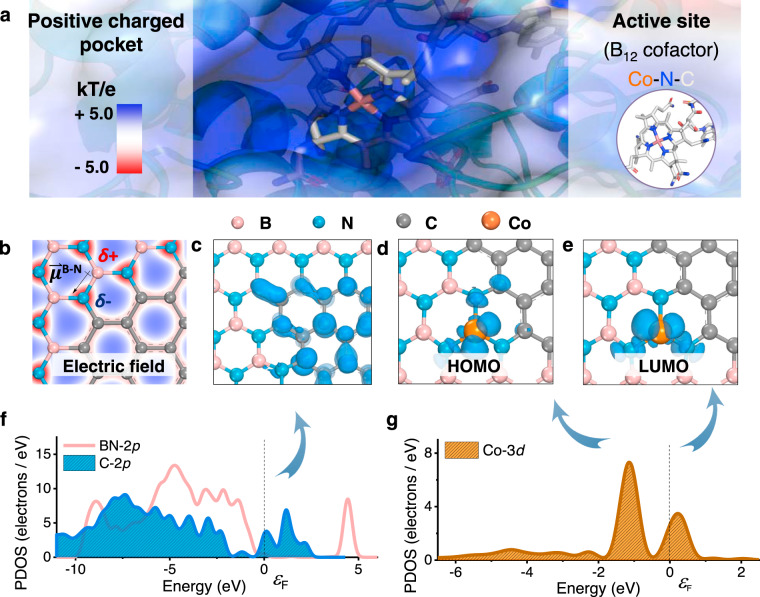
Fig. 1. DFT calculations of Co SAs/BCN.
a Electrostatic surface representation of the Rdh; the potential contour was scaled to +5.0 (blue) and −5.0 (red) kBTe−1 (where kB is the Boltzmann constant, T is temperature, and e is the charge of an electron). b Electron density plots of BCN with the electric field around B–N bond; the isosurface contours reveal discontinuity in electron density between the N (negative charged) and B (positive charged) atoms. c Orbital density images of C atoms in BCN. d HOMO and e LUMO of isolated Co atom supported on BCN. f PDOS plot of BN-2p and C-2p orbitals. g PDOS plot of Co-3d orbitals; the peaks were imaged in d, e.

