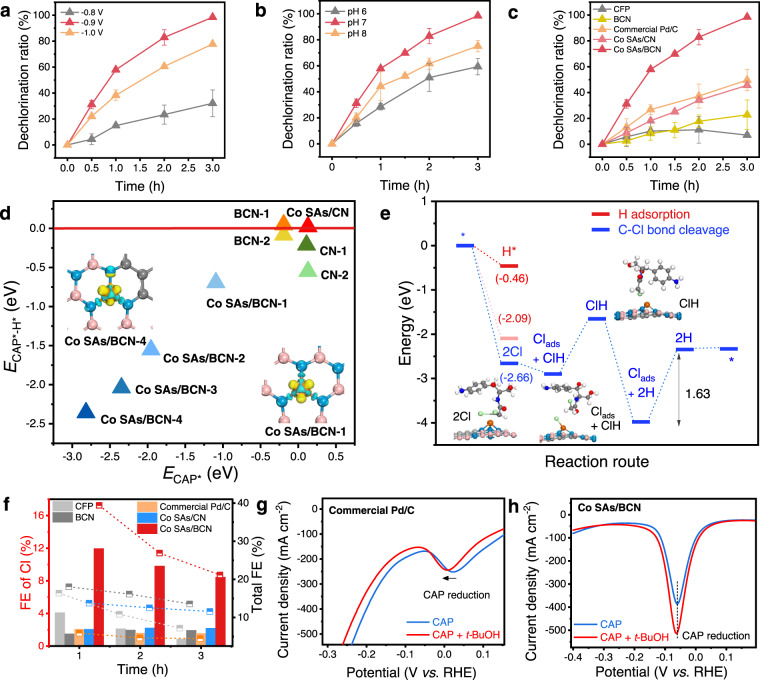
Fig. 4. Catalytic mechanism of CAP electrocatalytic dechlorination.
a, b Dechlorination ratio of CAP on various cathode potentials and at different pHs over the Co SAs/BCN, respectively. c Dechlorination ratio of CAP on various catalysts after 3 h electrolysis at −0.9 V. d Plot of the energy difference ECAP* − EH* against the ECAP*; detailed structures are given for BCN-1 and BCN-2 (Supplementary Fig. 22), Co SAs/BCN-1 to −4 (Supplementary Fig. 32), CN-1, CN-2, and Co SAs/CN (Supplementary Fig. 36). e Energy diagrams and intermediate states of CAP dechlorination on the Co SAs/BCN; the optimized structures are detailed in Supplementary Fig. 33. f Faradaic efficiency (FE) of CAP reduction. Left axis denotes the FE of CAP dechlorination (histogram). Right axis denotes the total FE of CAP reduction (dashed line), including the dechlorination reaction and the NO2 reduction of CAP. g, h Differential pulse voltammetry (DPV) curves of the commercial Pd/C and Co SAs/BCN, respectively, in solutions of 0.5 M H2SO4 with dose of CAP and t-BuOH.

