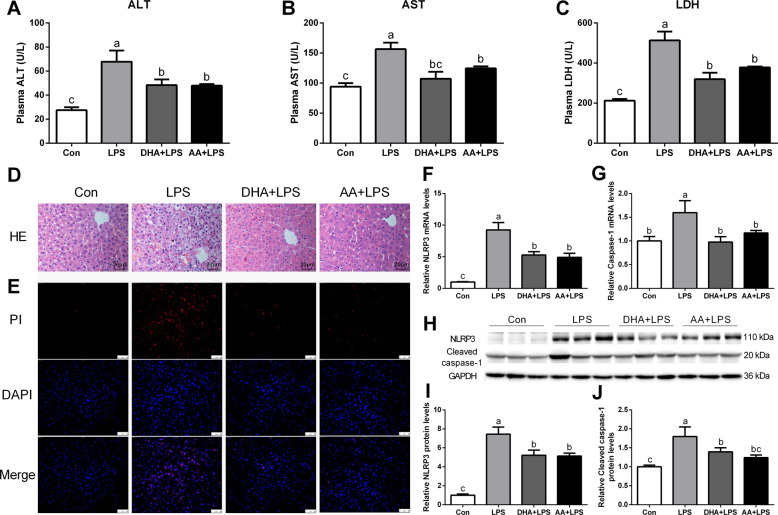
Fig. 5. DHA/AA ameliorated hepatic injury in LPS-induced mice.
A–C Plasma ALT, AST, and LDH levels were measured (n = 6 mice per group). D Representative images of hematoxylin and eosin staining (scale bar, 20 μm, n = 3 mice per group). E Immunofluorescence images of PI staining (scale bar, 50 μm, n = 3 mice per group). F, G mRNA levels of NLRP3 and caspase-1 were determined by quantitative real-time PCR (n = 6 mice per group). H–J Protein levels of NLRP3 and caspase-1 were determined by western blot analysis (n = 6 mice per group). In the bar graph, data represent the means ± SEM. Mean values not sharing the same letters are significantly different, P < 0.05.

