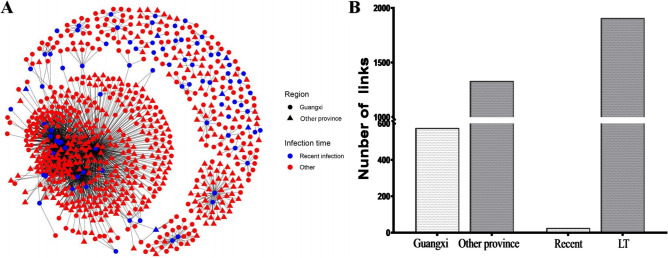
Figure 4.
Risk factors of recently infected individuals. The network was constructed using a custom R script with the network package in R version 4.0.2 software. (A) Recently infected individuals in transmission networks. Different shapes represent different provinces: solid circle: Guangxi; solid triangle: other provinces. Different colours represent different infection time. Blue, recent infection; red, long-term infection. (B) The total number of the links of recent infections in Guangxi with other infections from different areas or for different infection times. Recent recent infection, LT long-term infection.

