Figure 1.
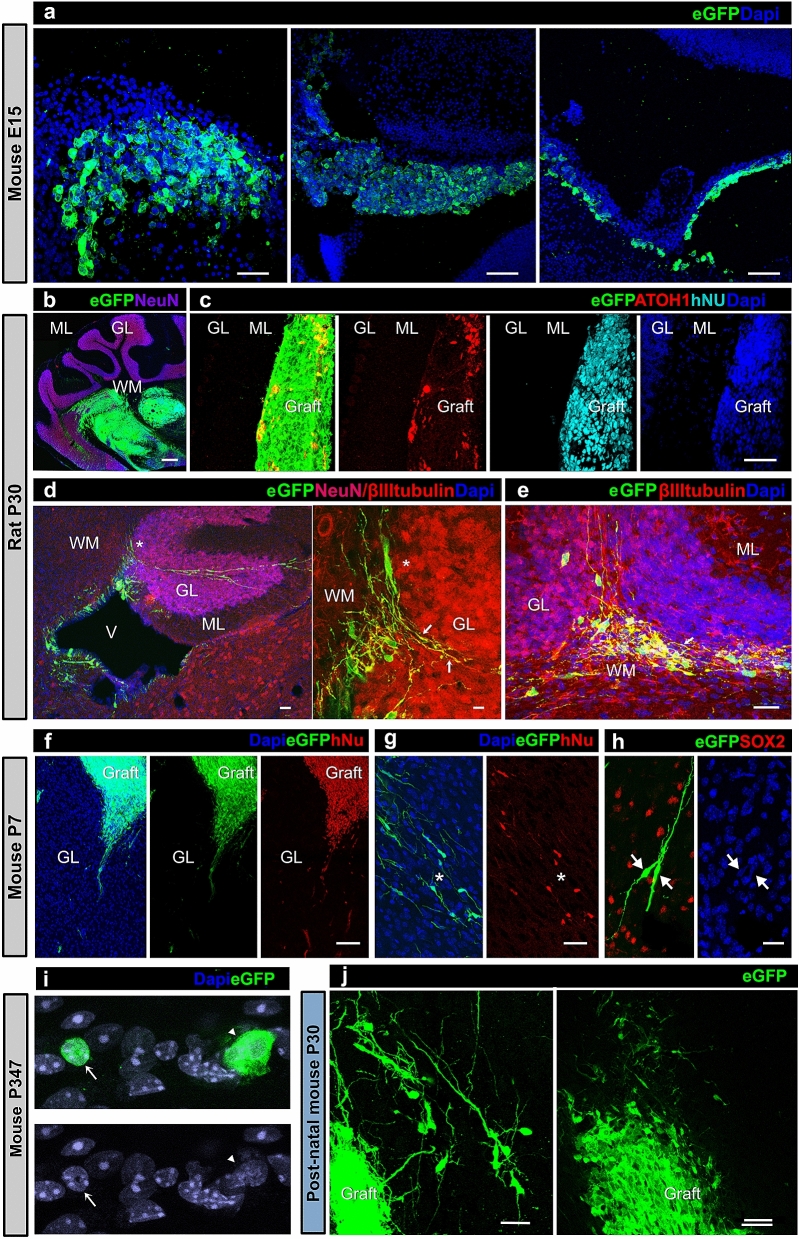
Representative photomicrographs of hiPSdNP transplanted in utero into the developing cerebellum of CD-1 mice (a, f, g, h and j) or Wistar rats (b, c, d, and e). Results of hiPSdNP transplantation in neonatal CD1 are shown in (i). All receiving animals were fully immunocompetent. (a) Embryos were collected at E15 the day after the transplant in utero. Three examples of hiPSdNP expressing eGFP engrafted in sagittal sections of the developing cerebellar and brainstem primordium: in the first image hiPSdNP are disperse in the developing cerebellar cortex (scale bar: 15 µm), in the second the engrafted cells are associated to the developing choroid plexus of the IV ventricle. (scale bar: 40 µm), the engrafted cells are located below the ependyma of the fourth ventricle (scale bar: 30 µm). (b) Rat cerebellum P30, the in utero grafted hiPSdNP cells are mostly located in the white matter core of the cerebellum close to the deep cerebellar nuclei. ML: molecular layer, GL: granular layer, WM: white matter. Scale bar: 100 µm. (c) Rat cerebellum P30 sagittal section, the in utero grafted eGFP expressing hiPSdNP cells are located in the molecular layer, some of the cells were immunopositive for ATOH1 an early marker of cerebellar differentiation, their human nature was confirmed by positivity to hNu antigen. Abbreviations as in 1b. Scale bar: 30 µm. (d) Rat cerebellum P30 sagittal section, the image on the right is an enlargement of the left one and the asterisks mark the same position in the two pictures. hiPSdNP cells migrating away from the initial transplant site show more differentiated morphologies, some of them are immmunopositive for β-III tubulin but none has NeuN positive nucleus. Arrows indicate neurites positive both for β-III tubulin and eGFP. Abbreviation as in 1b and V: fourth ventricle. Scale bar for image on the left: 15 µm, for the enlargement on the right: 5 µm. (e) Another example of a successful transplant in P30 rat. Abbreviations as in 1b, arrow as in 1d. Scale bar: 15 µm. (f) Mouse cerebellum P7. There is a complete overlapping between EGFP and hNu positive cells indicating that all cells derive from the transplant, this is true also for cells that started to migrate away from the transplant, abbreviation as in 1b. Scale bar: 35 µm. (g) Mouse cerebellum P7. Complete overlapping between eGFP and hNu positivity is also present in bipolar cells that are scattered in the host cerebellum, abbreviation as in 1b. Scale bar: 25 µm. (h) Mouse cerebellum P7. Two cells derived from hiPSdNP with bipolar morphology, they appear SOX2 negative even if the field is rich in SOX2 positive host cells, arrowhead mark the position of the nuclei of the transplant derived cells that, when stained with Dapi, show a different degree of chromatin condensation compared to the host surrounding cells. Scale bar: 10 µm. (i) Mouse cerebellum P30, transplant P3. Graft derived cells are both clustered and dispersed into the host tissue. Morphological differentiation is more advanced in cells migrating away from the graft. Scale bars: 10 µm (left), 15 µm (right). (j) Mouse cerebellum P347. Starting from about one month post natal, only very few cells are eGFP positive, morphologically they differ from both glial and neuronal cells, being devoid of extensions, some of them appear binucleated (arrowhead), other have a chromatin condensation pattern that is undistinguishable from that of the host (arrow). Scale bar: 5 µm.

