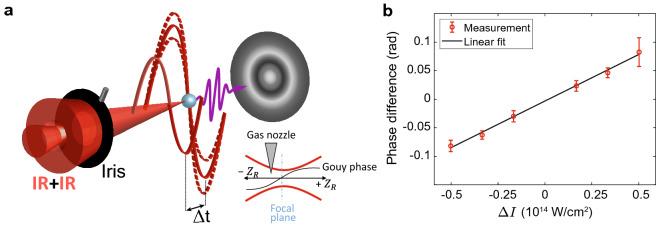
Figure 6.
Measurement of the Gouy phase variation. (a) Experimental scheme. By turning off the reference HHG source and removing the Al filter, we induce an interference between the inner and outer parts of the IR beam. Scanning the relative delay leads to oscillations of the HHG signal at the target gas nozzle with the IR frequency . Varying the iris affects only the outer part of the IR beam, which enables us to determine the Gouy phase shift as a function of iris size from the Fourier analysis of the HHG signal oscillations. (b) Experimental Gouy phase variation as a function of the intensity variation . The black line represents a linear fit to the experimental data (red points).

