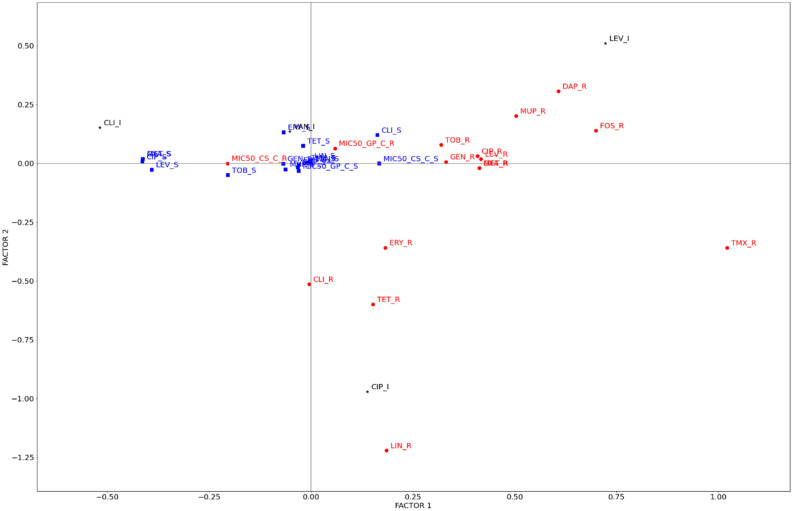
Figure 6.
MCA results for categorical values (resistance, sensitiveness or intermediate) as points. Distribution of the different groups of isolates divided based on their resistance or sensitivity to the different clinical antibiotics and extracts tested. R (red text and red circles), I (black text and black * symbols) and S (blue text and blue squares) indicate resistant, intermediate and sensitive, respectively. Two magnified inserts and connections between antibiotics have been included for clarification in Supplementary Fig. S5.

