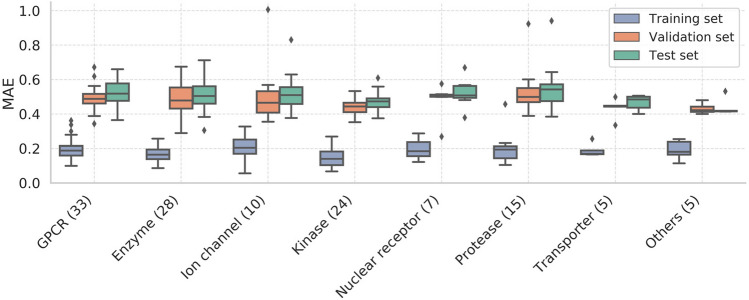
Figure 2.
Box-whisker plots of the MAE of the ensemble models for each protein family. The horizontal lines in the boxes indicate the medians, the ends of the whiskers indicate the maximum and minimum MAE values, the bottoms and tops of the boxes are the 25th and 75th percentiles, and the points outside the whiskers are outliers. The number after each name on the x-axis shows the number of targets in each family. The same colour code for the data subsets is used throughout this manuscript.

