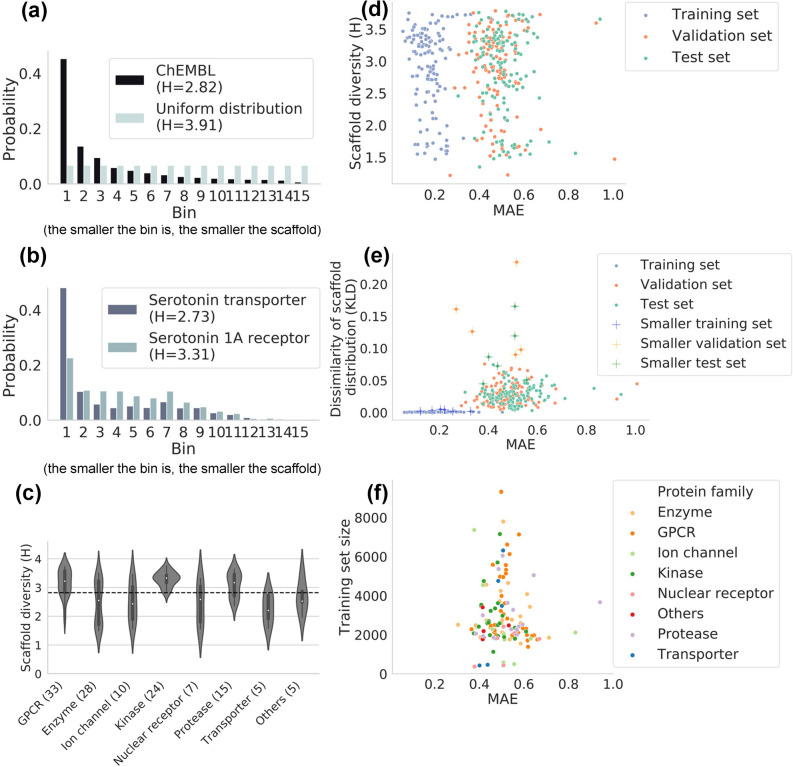
Figure 3.
Effect of the scaffold diversity of the datasets on the prediction performance. (a) The probability distribution of the scaffolds in ChEMBL. Compared to the uniform distribution, ChEMBL is much more biased towards smaller scaffolds, resulting in a smaller H value. (b) The probability distribution of the scaffolds in the dataset for the serotonin transporter (SERT) and serotonin 1A receptor (5-HT1A). The H value is larger for 5-HT1A, whose scaffold distribution is wider than that of SERT. (c) Violin plots of the H value distribution by protein family. The number after each name on the x-axis shows the number of targets in each family. (d–f) Effect of the scaffold diversity (d), the dissimilarity of the scaffold distribution (e), and the training set size (f) on the MAE.

