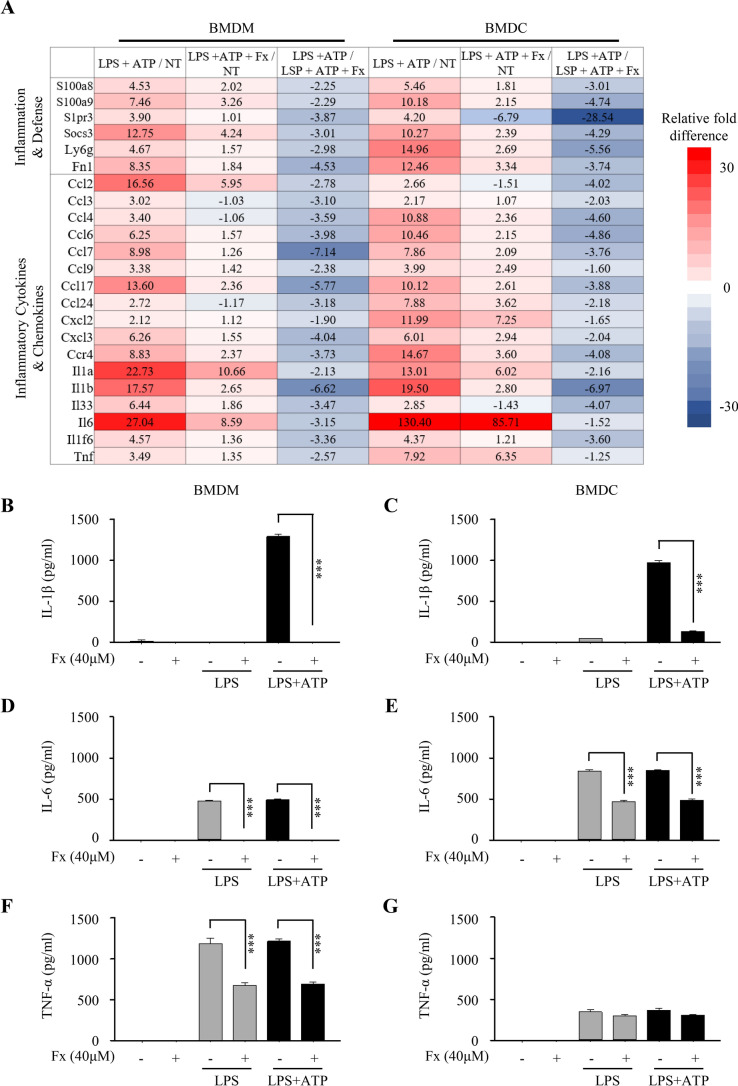
Figure 3.
Gene expression profiling analysis and pro-inflammatory cytokine measurement in LPS or LPS/ATP-treated bone marrow-derived macrophages (BMDMs) and dendritic cells (BMDCs). (A) Functional groups of genes expression in BMDMs and BMDCs treated with LPS and ATP in the presence or absence of fucoxanthin. Red and blue color indicates expression levels higher or lower than non-treated cells, respectively. NT, non-treated cells. (B–G) BMDMs and BMDCs were pre-treated with fucoxanthin (40 μM) 4 h prior to treatment of LPS (1 μg/ml) and ATP (5 mM). The secretion of the IL-1β (B,C), IL-6 (D,E) and TNF-α (F,G) by BMDMs and BMDCs was measured by ELISA. Data are presented as mean ± SEM. ***P ≤ 0.001 (one-way ANOVA followed by Bonferroni's post hoc comparisons tests).

