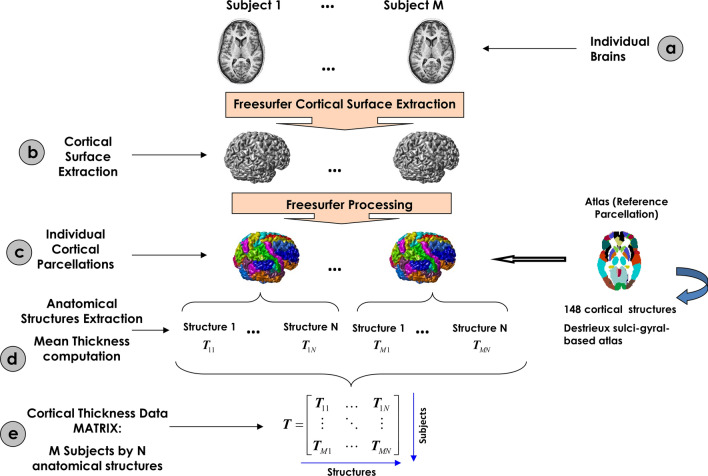
Figure 1.
Flowchart of the cortical thickness matrix construction. (a) Representation of the M individual anatomic MRI images. (b) During FreeSurfer processing, the cortical surface of the M subjects was extracted. (c) Using the FreeSurfer toolbox, the cortical surfaces were labeled using a reference atlas. (d) The cortical thickness for each structure was calculated as the mean thickness of all vertices defined as belongs to that structure. (e) All mean thickness values for all structures and subjects were organized in an array denoted by T of M rows by N columns.

